flowchart LR

Dose --> C[Central]

subgraph One compartment
C
end
One-Compartment vs Multi-Compartment Models
Understand how profile shape reveals whether a system behaves like one or multiple compartments.
Tip
What you’ll build today: intuition for recognizing when a system behaves like a single well-mixed space vs multiple interacting spaces.
Learning Objectives
By the end of this lesson, you will be able to:
- Distinguish one- vs multi-compartment behavior
- Interpret multi-phase decline using log-scale thinking
- Understand what added complexity represents
- Recognize when data support (or do not support) more compartments
Key Ideas
Compartment models differ based on how many “distinct behaviors” are needed to explain the data.
One-compartment model
- Assumes the body behaves like a single well-mixed system
- Decline appears as a single exponential phase
Multi-compartment model
- Assumes multiple interacting spaces
- Decline shows multiple phases (slopes)
Insight: The number of compartments reflects the complexity needed to explain the data, not the true number of physical spaces.
Warning
Adding compartments does not make a model “more correct.”
It only makes it more complex.
Conceptual Model Structures
The difference between one- and multi-compartment models is not anatomy.
It is the amount of behavioral structure needed to explain the observations.
flowchart LR

Dose --> C[Central]

C <--> P[Peripheral]

subgraph Multi compartment
C
P
end
One model assumes one dominant observable behavior.
The other allows multiple interacting behaviors.
Worked Example: Linear vs Log Interpretation
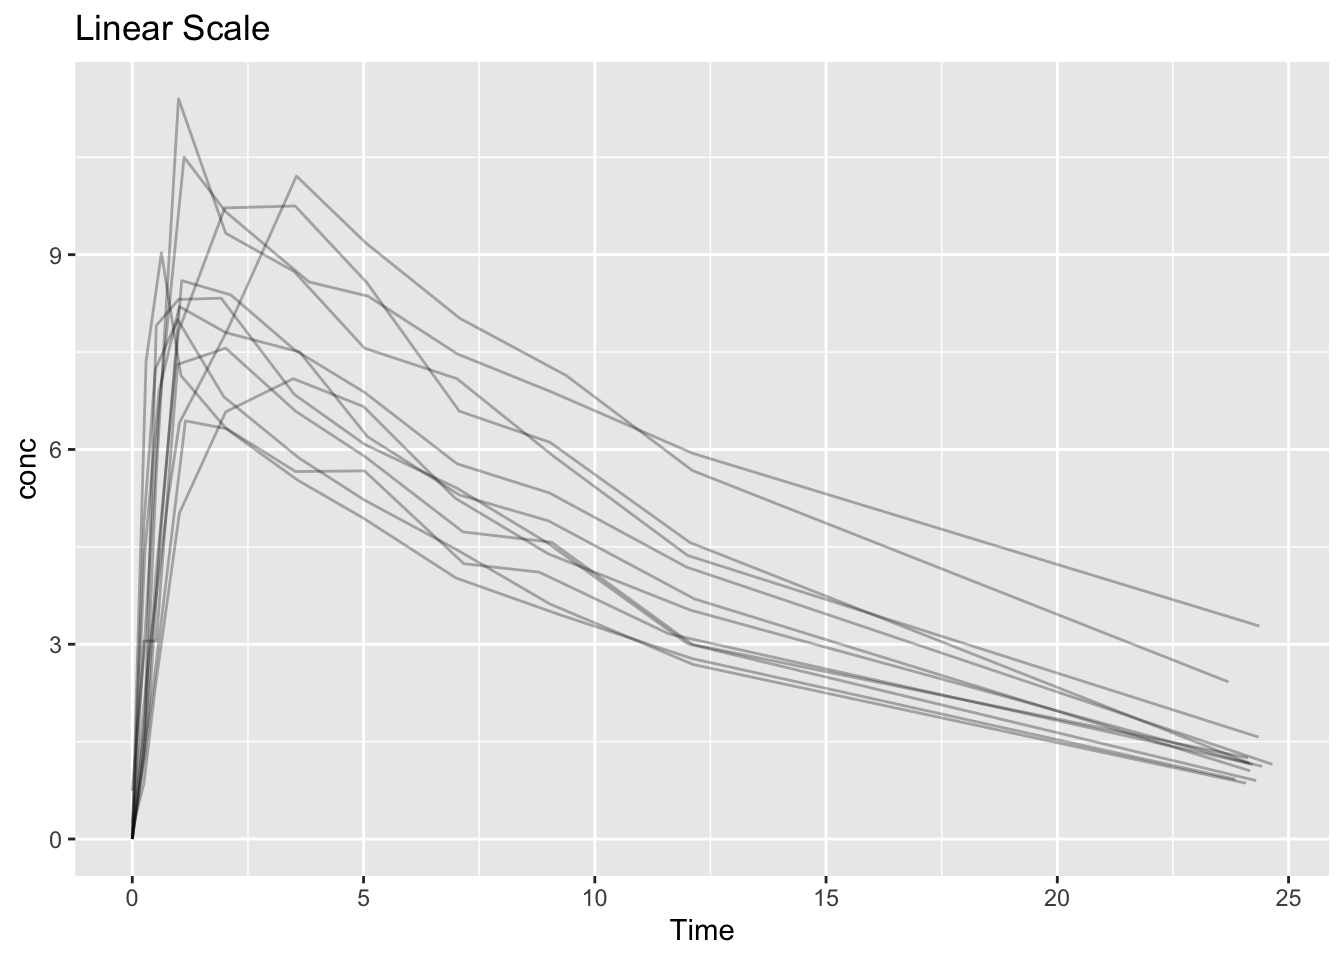
Linear scale
- Smooth curve
- Hard to distinguish phases
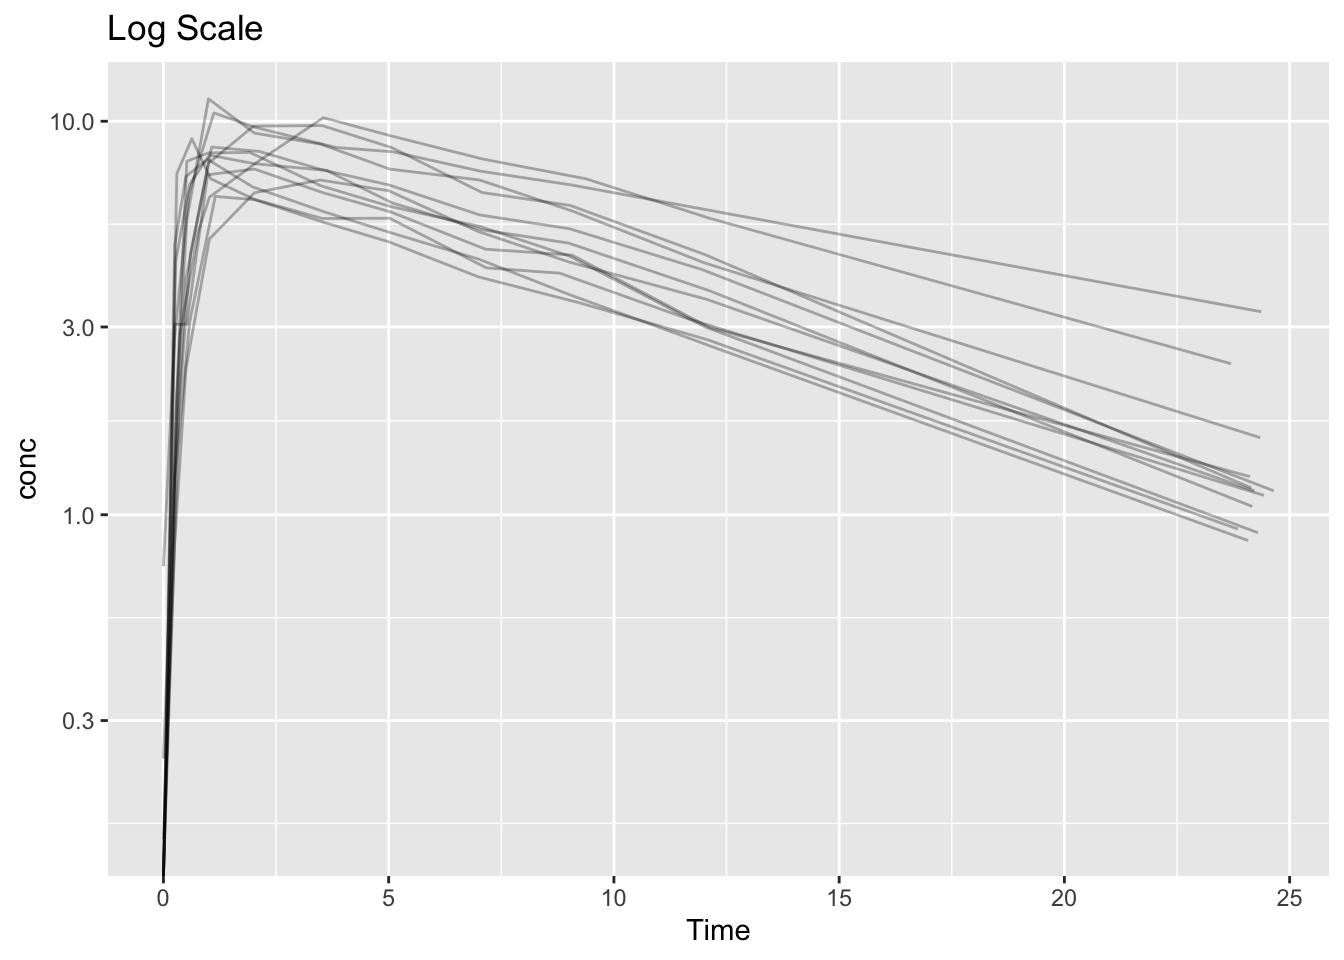
Log scale
- Straight line → one-compartment behavior
- Multiple slopes → multi-compartment behavior
👉 This is one of the most important practical tools in PK.
Expanding the Example
The easiest way to see compartment behavior is to compare the same data on linear and log scales.
Case 1: One-Compartment-Like Behavior
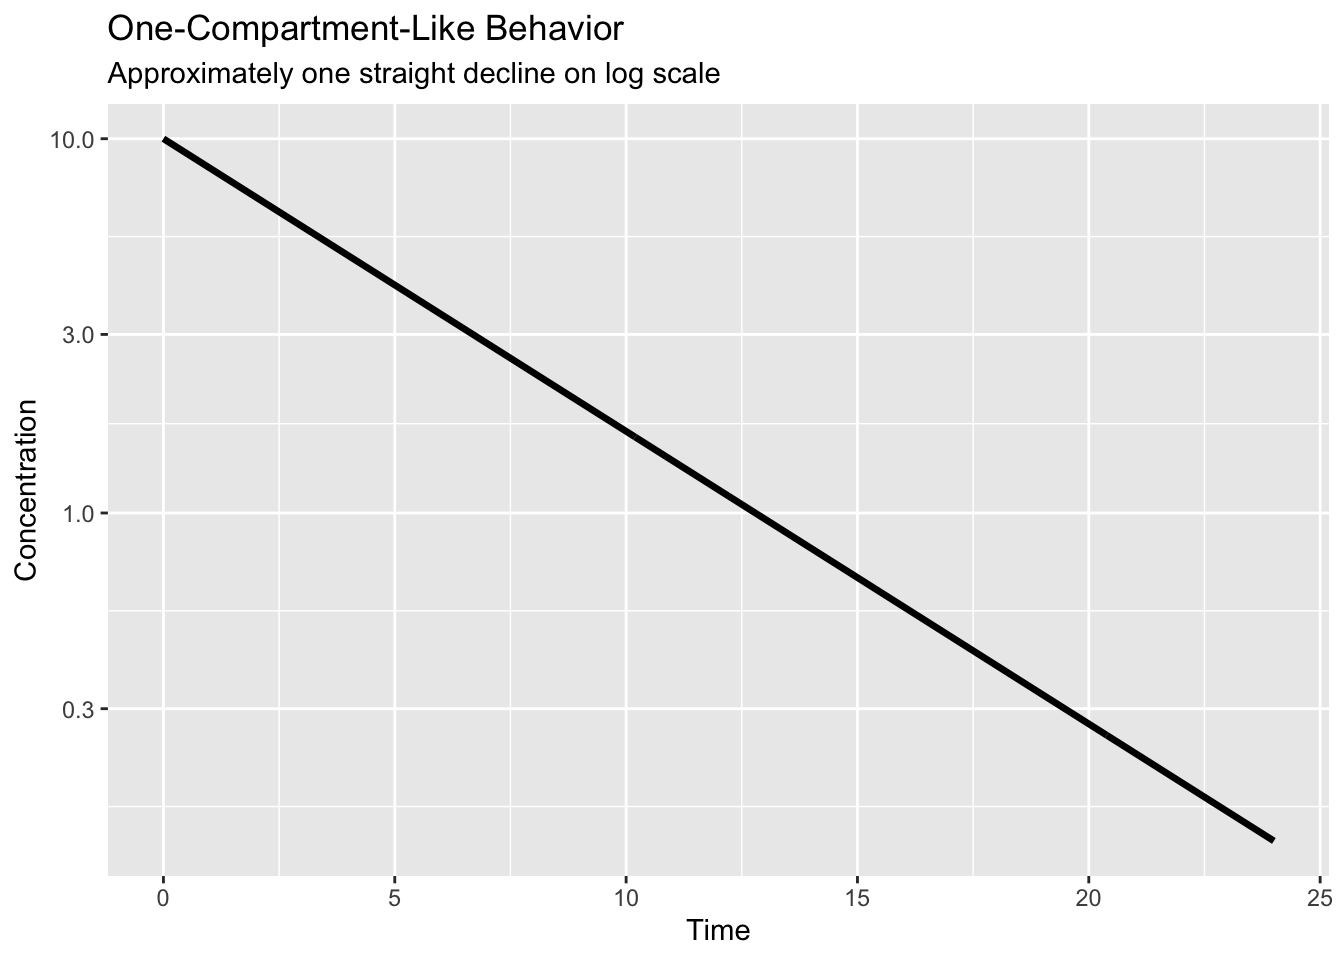
Notice:
- one dominant slope
- relatively simple decline
- little evidence of separate phases
Case 2: Multi-Compartment-Like Behavior
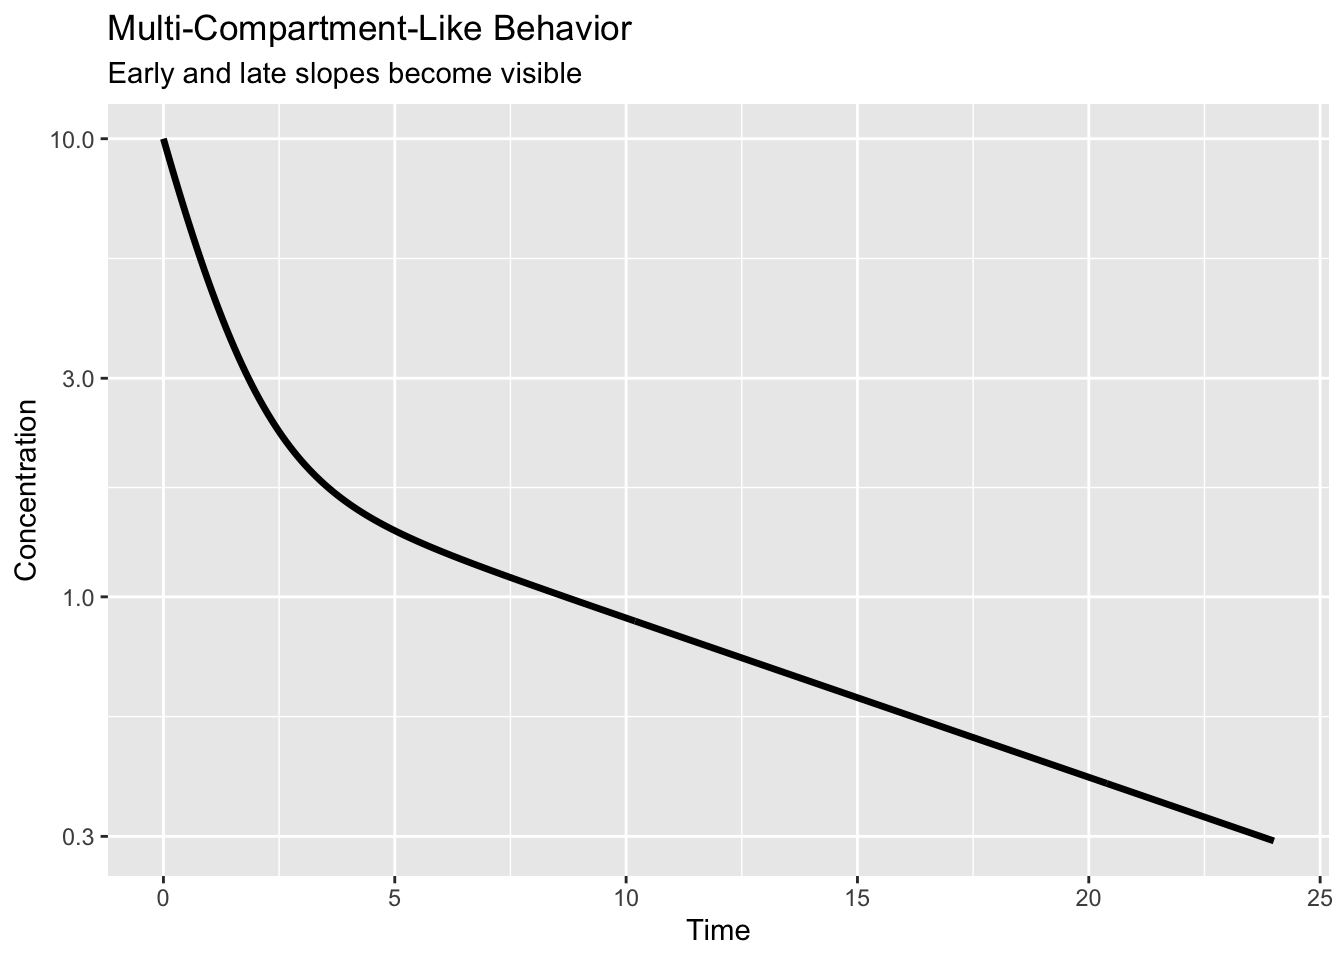
Notice:
- steep early decline
- later slower decline
- visible change in slope
That changing slope suggests multiple observable phases.
This does not prove a specific compartment structure.
But it suggests that one dominant process may not be enough.
Insight
A key question is:
“Does the data require more than one phase to explain the decline?”
If yes → additional compartments may be justified
If no → simpler model may be sufficient
Note
Always prefer the simplest model that adequately explains the data.
Strategies
- Always inspect log-scale plots
- Look for changes in slope over time
- Compare early vs late behavior
- Add complexity only when clearly supported
Common Mistakes
- Overfitting by adding unnecessary compartments
- Ignoring multi-phase behavior in the data
- Relying only on linear-scale plots
- Assuming more complex models are inherently better
Practice Problems
- What does a straight line on a log-scale PK plot suggest?
- What indicates multi-compartment behavior?
- Why shouldn’t you always choose the more complex model?
TipStep-by-Step Solutions
- A single exponential decline (one-compartment behavior)
- Multiple slopes or phases in the decline
- Because complexity should match data, not preference
Summary
One-compartment models: - describe simple, single-phase behavior
Multi-compartment models: - describe systems with multiple observable phases
The goal is not to maximize complexity—but to match the structure of the data.
TipQuick Tips
- Always check log scale
- One slope = simple system
- Multiple slopes = multiple processes
- Simplicity is preferred
- Complexity must be justified