Likelihood and Model Fit (Intuition)
Build intuition for likelihood, how models are fit to data, and how likelihood connects estimation to decisions.
Tip
What you’ll build today: a clear, intuitive understanding of likelihood—what it means, how it drives estimation, and how it connects models to real-world decisions.
Learning Objectives
By the end of this lesson, you will be able to:
- Explain likelihood in plain language
- Understand how likelihood is used to fit models
- Connect likelihood to estimation methods (FOCE, SAEM, Bayesian)
- Recognize what “good fit” actually means
Key Ideas
All model estimation methods are trying to answer the same question:
What parameter values make the observed data most plausible?
This is captured by the likelihood:
\[ L(\theta) = P(\text{data} \mid \theta) \]
- \(\theta\) = model parameters
- \(L(\theta)\) = how well those parameters explain the data
Insight: Likelihood is not about whether the model is “true”—it is about how well it explains what we observed.
Warning
A model can have high likelihood and still be wrong in a scientific sense.
Likelihood measures fit to data—not correctness of assumptions.
Why This Lesson Matters
You’ve seen:
- models (structure)
- variability (random effects)
- estimation methods (FOCE, SAEM, Bayesian)
Likelihood is the concept that connects all of them.
Without it:
- estimation becomes a black box
- results feel like “software output”
With it:
You understand why the model chose those parameter values.
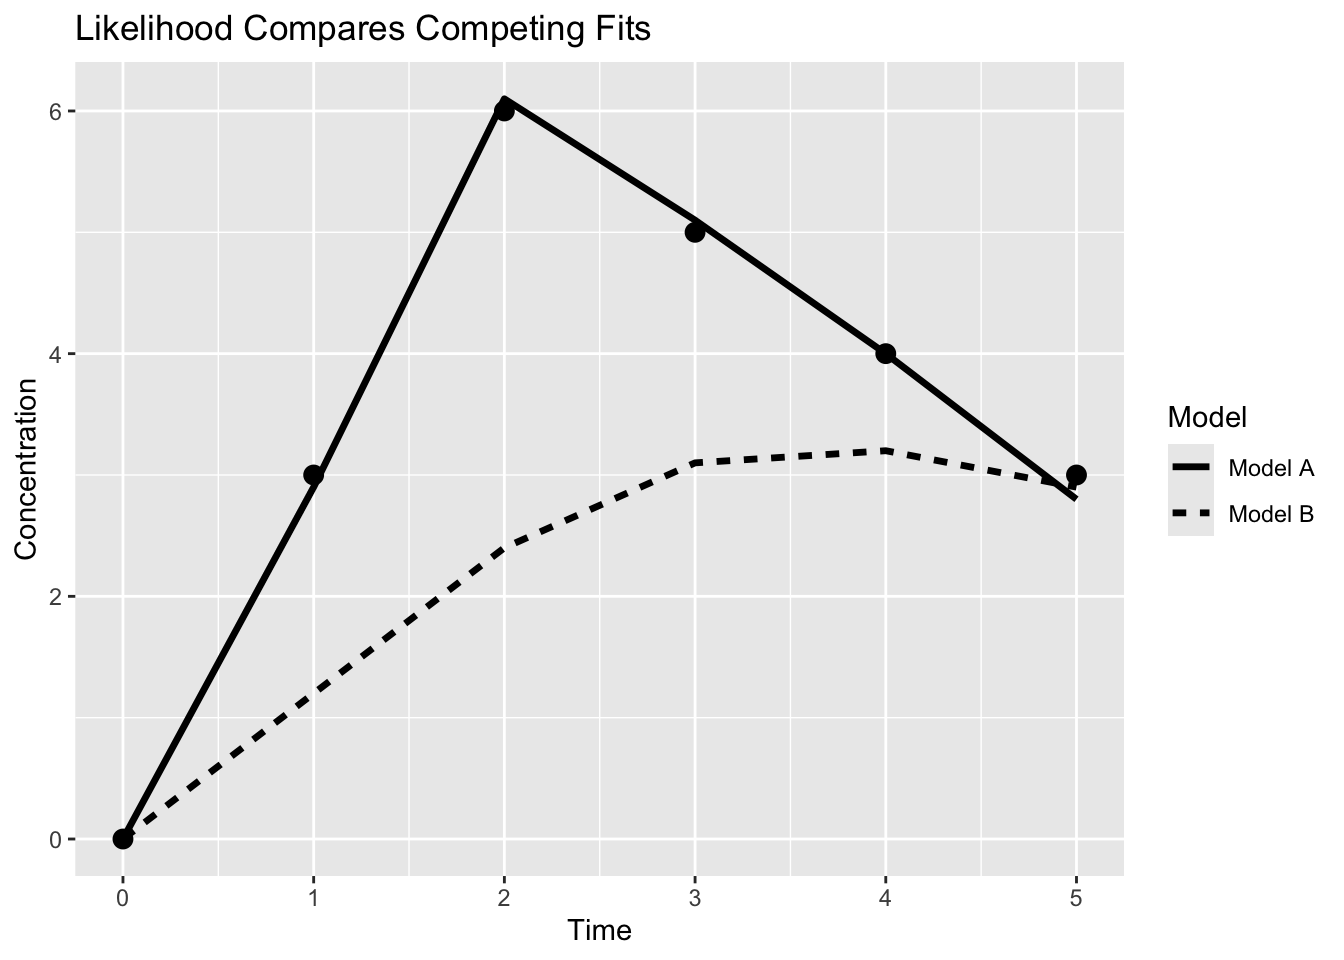
Worked Example: Two Possible Fits
Suppose two models attempt to explain the same observations.
Compare the models:
- Model A follows the observations closely
- Model B misses important features
Model A therefore has higher likelihood.
Interpreting Likelihood
Likelihood answers:
- How close are predictions to observations?
- How consistent is the model with the data?
Better fit → higher likelihood
Worse fit → lower likelihood
Visualizing Likelihood
Likelihood compares parameter choices.
flowchart LR

P1["Parameters A"]

-->

L1["Likelihood"]

P2["Parameters B"]

-->

L2["Likelihood"]

L1 -->

BEST["Choose Better Fit"]

L2 -->

BEST
Estimation searches for parameter values that improve likelihood.
Log-Likelihood and Log-Likelihood
In practice, we use:
\[ \log L(\theta)=\log P(\text{data}\mid\theta) \]
The best fit corresponds to the parameter values that maximize this quantity.
We work with log-likelihood because it is:
- easier to compute
- numerically stable
- able to turn products into sums
From Likelihood to Objective Function
Many pharmacometric software packages do not report likelihood directly.
Instead they report an objective function value (OFV):
\[ OFV = -2\log L \]
where:
- \(L\) is the likelihood
- lower OFV indicates better agreement with the data
This transformation makes optimization easier and creates a common scale for comparing models.
You do not need to calculate OFV manually.
NoteKey Takeaway
Higher likelihood ↔︎ Lower OFV
These contain the same information expressed on different scales.
Expanding the Idea: Noise Matters
Real data are noisy.
So models are not expected to pass exactly through every observation.
Instead, likelihood evaluates:
- how close predictions are to observations
- whether those differences are consistent with expected variability
This is why residual error models matter.
Imagine repeating the same experiment.
Even with identical parameters:
- observations would change slightly
- the likelihood would change accordingly
A good model therefore does not explain every point perfectly.
It explains the data within expected variability.
Insight
A “good fit” is not a perfect curve—it is a model that explains the data within expected variability.
Note
Overfitting can increase likelihood locally, but harm generalizability.
Connecting to Estimation Methods
Different methods work with the likelihood in different ways:
- FO / FOCE → linear approximations
- SAEM → simulation-based approximation
- Bayesian → full posterior (likelihood × prior)
But:
They are all trying to maximize (or explore) the same likelihood.
Why Likelihood Matters for Decisions
Likelihood affects:
- parameter estimates
- uncertainty
- predictions
If likelihood is misleading:
- parameters may be biased
- predictions may be wrong
- decisions may fail
Strategies
- Evaluate fit visually and statistically
- Consider variability, not just mean fit
- Compare models using likelihood-based criteria such as changes in objective function value (ΔOFV), AIC, and BIC
- Use likelihood as a guide, not a guarantee
Common Mistakes
- Treating likelihood as proof of correctness
- Ignoring model assumptions
- Overfitting to maximize likelihood
- Assuming higher likelihood always means better model for decisions
Practice Problems
- What does likelihood represent?
- Why isn’t perfect fit required?
- How do estimation methods differ in handling likelihood?
TipStep-by-Step Solutions
- The probability of observing the data given parameter values.
- Because data contain variability and noise.
- They use different approximations or frameworks to evaluate likelihood.
Summary
Likelihood:
- measures how plausible the observed data are under a model
- drives parameter estimation
- connects models to observations
But it does not:
- guarantee correctness
- replace scientific reasoning
TipQuick Tips
- Likelihood = “how plausible is this model given the data?”
- Higher likelihood = better fit (not necessarily better science)
- Always consider variability
- Use likelihood to compare models—not to blindly trust them