What Concentration–Time Data Represents
Understand what PK data actually represents and how to interpret concentration–time profiles.
Tip
What you’ll build today: intuition for what concentration–time data actually represents in a biological and clinical context.
Learning Objectives
By the end of this lesson, you will be able to:
- Explain what concentration–time data represents.
- Interpret the meaning of a PK profile.
- Distinguish observation from underlying biology.
- Recognize why discrete samples cannot be equated with the full underlying system.
Key Ideas
A concentration–time profile is not just a curve.
It is a set of sampled observations of an underlying biological system.
Each point represents:
- a measured concentration
- at a specific time
- under specific study conditions
- with measurement noise and biological variability
That means the dataset is always a partial view of what the body is doing.
Insight: You never observe the true system directly. You observe snapshots of it.
Warning
It is easy to mistake a plotted profile for the “truth.”
In reality, it is a collection of discrete observations used to infer a continuous process.
Why This Matters in PMx
Pharmacometrics begins with the idea that observations are informative, but incomplete.
When you look at a concentration–time profile, you are trying to reason from:
- what was measured
- when it was measured
- how reliably it was measured
- what likely happened between measurements
This is why plotting, modeling, and interpretation are all connected.
A profile is not just “data on a graph.” It is evidence about absorption, distribution, elimination, and variability.
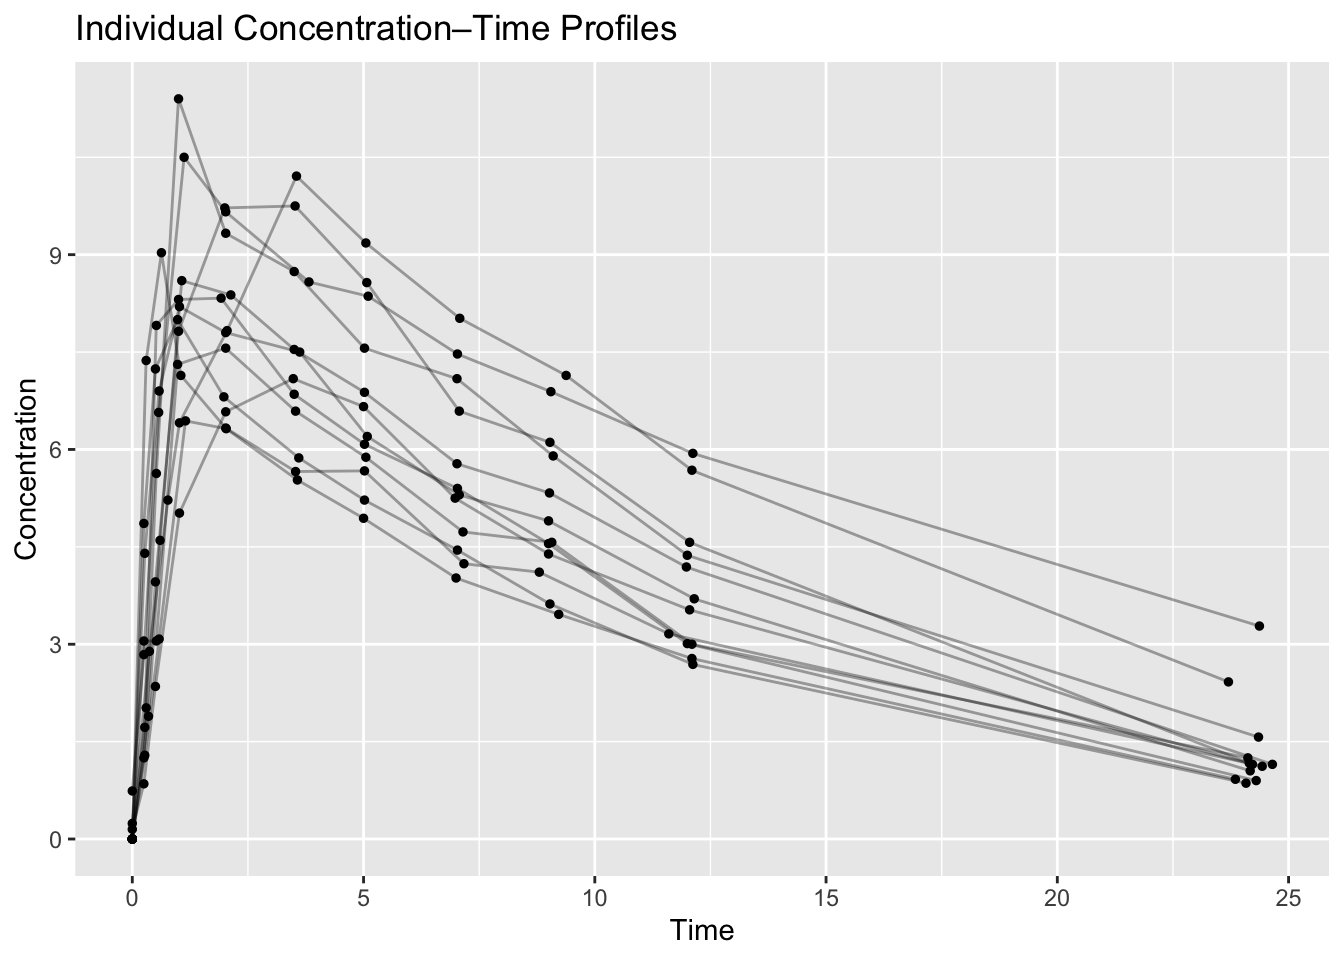
Worked Example: Individual Profiles in Theoph
Each line represents one subject. Each point is one measured concentration at one sampling time.
Before asking any modeling question, ask:
- Do the profiles have a plausible shape?
- Do some subjects look very different from others?
- Are there obvious outliers or unusual time patterns?
- Are there enough points to understand the trajectory?
This is already pharmacometric thinking. You are moving from observation toward interpretation.
Expanding the Example: Sparse vs Dense Sampling
Two subjects can receive the same dose and still provide very different levels of information.
Here we compare:
- one profile using all observed samples
- the same profile after keeping only a few observations
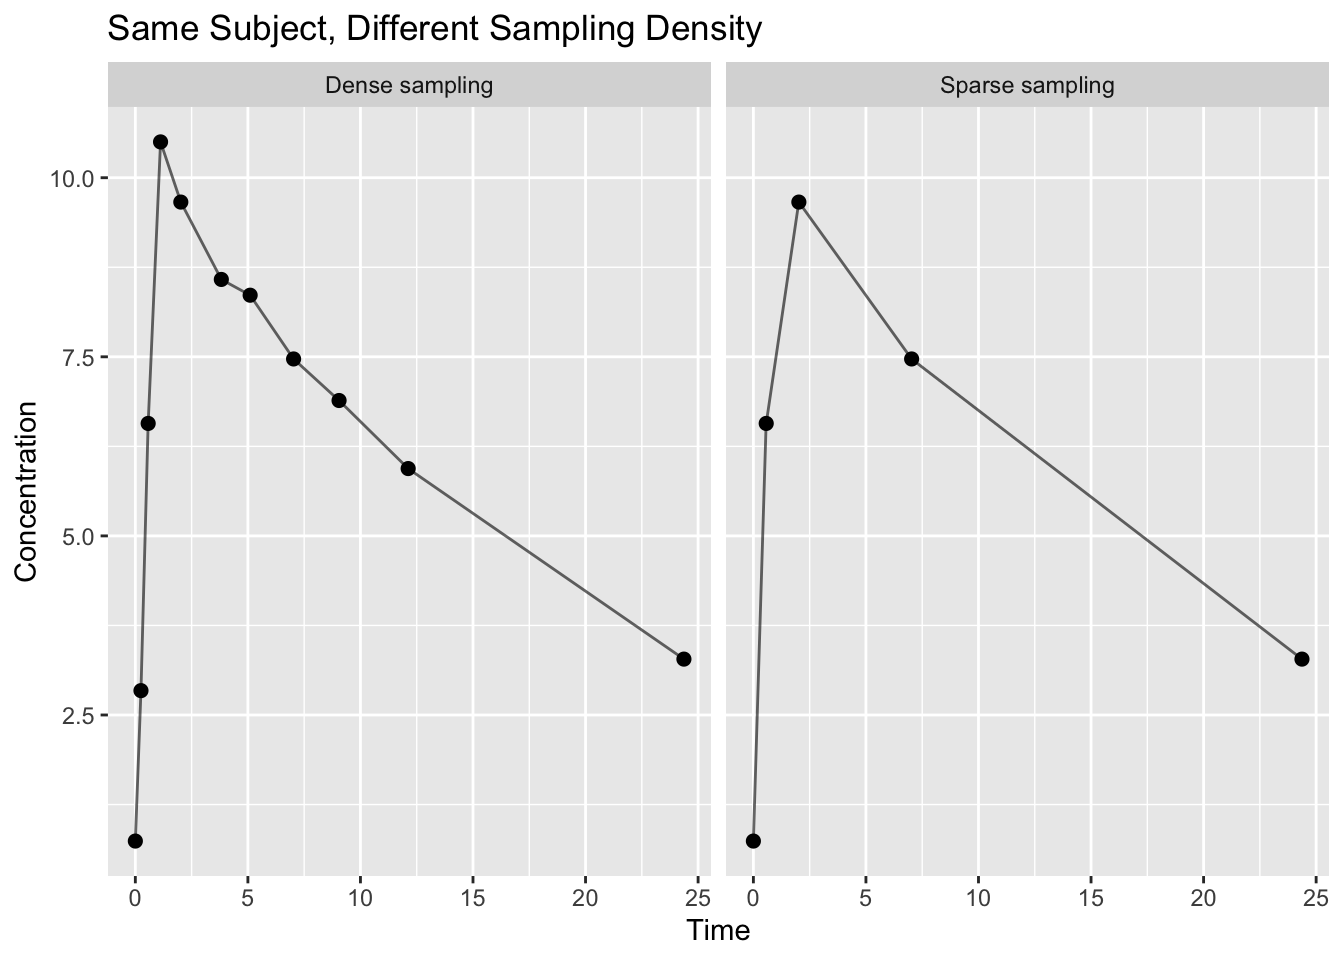
Notice that both plots describe the same subject.
Questions:
- Can you identify peak concentration equally well?
- Would you trust estimates of elimination equally?
- Which profile gives more confidence about what happened between observations?
Sparse data do not necessarily mean poor data.
But sparse data support fewer conclusions.
Insight
What you see on the plot:
- discrete measured points
What you infer from the plot:
- a continuous biological process
That gap is where pharmacometrics lives.
Models do not replace the data. They help connect the observed samples to the underlying system those samples came from.
Note
A useful habit is to ask: “What is observed here, and what am I inferring?”
That question prevents over-interpretation very early.
Common Problem Types
- Sparse sampling across time points
- Inconsistent or uneven sampling schedules
- Measurement noise and assay variability
- Limited data density for individual profiles
Strategies
- Separate observation from process
- Inspect individual profiles before looking at summaries
- Ask whether the sampling schedule supports the interpretation you want to make
- Use plots as a way to understand what is present in the data before explaining it
Common Mistakes
- Treating observed concentrations as exact truth
- Over-interpreting sparsely sampled profiles
- Assuming the plotted curve represents a continuous measured process
- Ignoring the impact of measurement noise and sampling design
- Reading too much into individual data points
Practice Problems
- What does a single concentration measurement represent?
- Why is a concentration–time profile only a partial view of the true system?
- Why can two profiles with the same dose still differ in what they allow you to conclude?
- What question should you ask before interpreting the shape between two observed points?
TipStep-by-Step Solutions
- A single concentration measurement is one observed value at one time under specific study conditions.
- Because the underlying biological system is continuous, but the data are collected at discrete times with noise and variability.
- Because differences in sampling density, timing, and quality affect how much structure can be inferred.
- Ask: “Am I observing this pattern directly, or inferring it between measurements?”
Summary
Concentration–time data are not the biological system itself.
They are observations sampled from that system.
That means every profile should be read as:
- evidence
- with limits
- shaped by design, measurement, and variability
Understanding that distinction is one of the first big steps in learning pharmacometrics.
TipQuick Tips
- Data are samples, not the full truth.
- Always separate what is observed from what is inferred.
- Sparse data support fewer conclusions.
- Look at individuals before summaries.
- The plotted curve is evidence about the system, not the system itself.