flowchart LR
    D[Dose administered] --> A[Absorption into observed system]
    A --> C[Measured concentration rises]
    C --> Dist[Distribution across body spaces]
    Dist --> Elim[Elimination removes drug]
Absorption, Distribution, and Elimination
Understand how the major PK phases shape a concentration–time profile and how to interpret them visually.
Tip
What you’ll build today: the ability to read a PK profile as a sequence of underlying biological processes.
Learning Objectives
By the end of this lesson, you will be able to:
- Identify absorption, distribution, and elimination phases.
- Explain how each phase contributes to profile shape.
- Recognize overlapping processes.
- Interpret different regions of the curve mechanistically.
Key Ideas
PK profiles are shaped by different processes dominating at different times.
- Absorption → drug enters systemic circulation
- Distribution → drug moves between body spaces
- Elimination → drug is removed from the body
These processes often overlap, rather than occurring in isolation.
Insight: A PK curve is not one process. It is a time-ordered mixture of processes.
Warning
Do not assume the declining portion of a curve is purely elimination.
Early decline often includes distribution effects as well.
A Simple Process Diagram
This diagram is simplified, but it is useful because it emphasizes sequence and overlap.
Worked Example: Reading a Profile
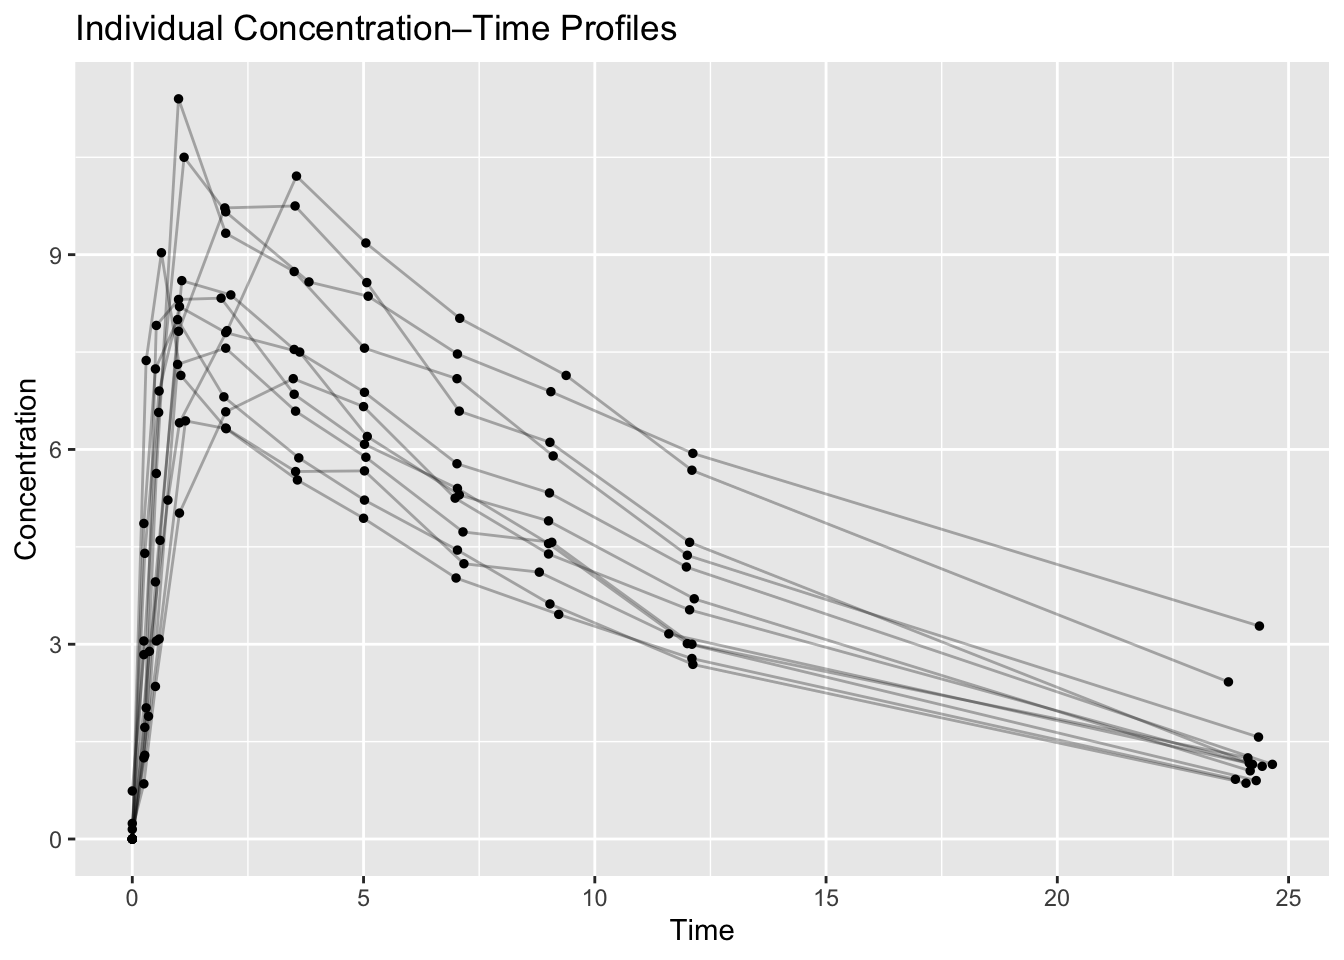
A simple visual reading might be:
- Rising phase → absorption dominates
- Early decline after the peak → distribution and elimination may both contribute
- Late decline → elimination tends to dominate more clearly
You do not need a fitted model yet to start reasoning this way. The shape itself already contains useful clues.
Expanding the Example
The same type of observed data can suggest different underlying stories.
Case 1: Sharp Rise → Smooth Decline
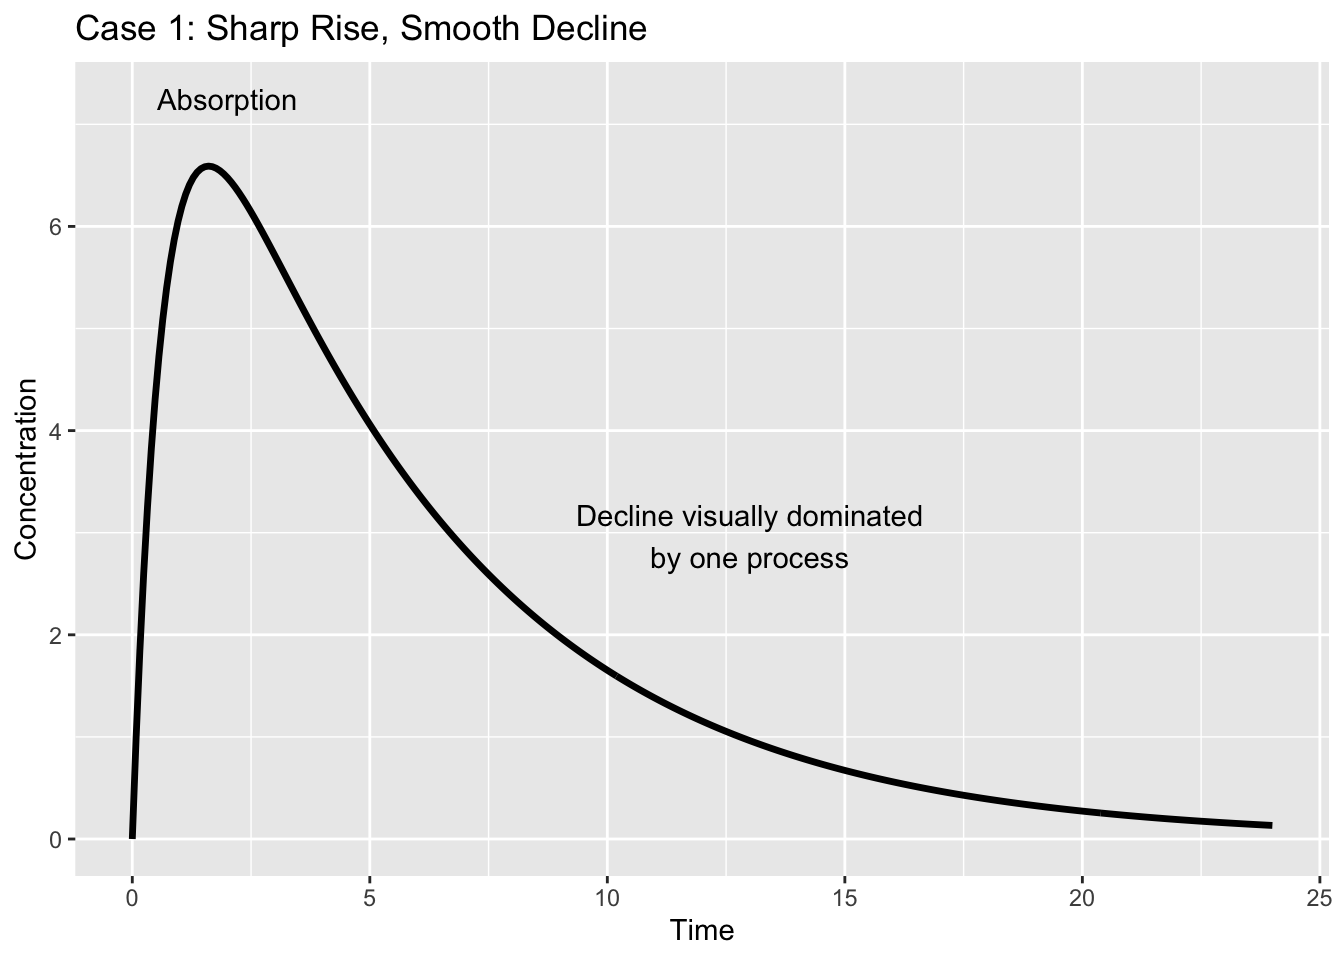
This profile looks visually simple.
You might interpret:
- rise → absorption dominates
- decline → one major decline phase appears dominant
That does not prove a one-compartment process, but visually the profile appears relatively simple.
Case 2: Sharp Peak → Fast Drop → Slow Tail
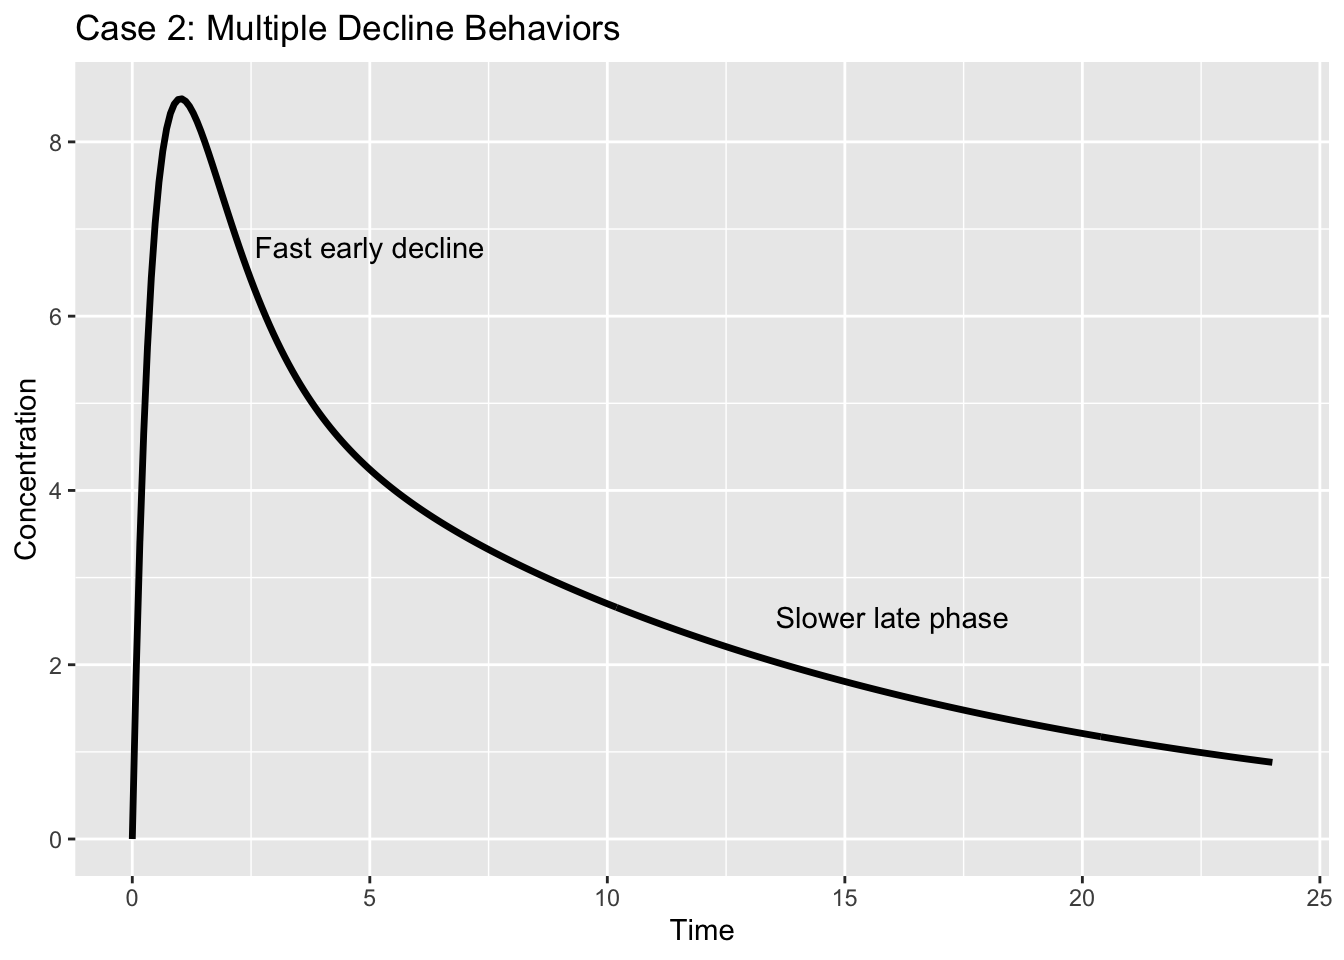
This profile suggests a different interpretation:
- rise → absorption
- early decline → distribution may contribute
- later decline → elimination appears more dominant
Same kind of observed data.
Different mechanistic reading.
Insight
Different regions of the profile answer different questions.
For example:
- the rising phase may tell you about absorption timing
- the early post-peak region may tell you whether decline is more complex than a single phase
- the late phase may be most useful for elimination-oriented interpretation
Note
A useful habit is to ask: “What process is most likely dominating this part of the curve?”
Strategies
- Read the profile in segments rather than as one undifferentiated curve
- Compare early and late slope behavior
- Compare linear and log scale views when needed to reveal structure
- Treat visual patterns as clues, not proof
Common Mistakes
- Assuming decline equals elimination
- Ignoring overlapping processes
- Treating the curve as if it reflects a single mechanism
- Over-interpreting poorly observed phases
Practice Problems
- What process typically dominates the rising portion of the profile?
- Why is the early decline after the peak not always pure elimination?
- Why can the late phase be especially useful for interpretation?
- What question should you ask when slope changes over time?
TipStep-by-Step Solutions
- Absorption usually dominates the rising portion of the profile.
- Because distribution and elimination can both contribute to early decline.
- Because later behavior may reflect a clearer elimination-dominant region.
- Ask: “What process is most likely dominating this part of the curve?”
Summary
PK profiles have shape because different processes dominate at different times.
Reading them well means recognizing that:
- rise does not just mean “drug is present”
- decline does not always mean “simple elimination”
- different regions of the curve can carry different mechanistic clues
This is one of the foundations of pharmacometric intuition.
TipQuick Tips
- Think in phases, not one curve.
- Early decline is not always pure elimination.
- Overlap between processes is normal.
- Use shape as a clue, not as proof of mechanism.
- Ask what process is likely dominating each region.