Simulation-Based Diagnostics (VPC and PPC)
Understand how simulation-based diagnostics evaluate model performance using Visual Predictive Checks (VPC) and Posterior Predictive Checks (PPC).
Tip
What you’ll build today: the ability to use simulation-based diagnostics to evaluate whether a model can reproduce observed data patterns.
Learning Objectives
By the end of this lesson, you will be able to:
- Explain the purpose of simulation-based diagnostics
- Understand Visual Predictive Checks (VPC)
- Understand Posterior Predictive Checks (PPC)
- Interpret discrepancies between simulated and observed data
Key Ideas
Residuals look at individual points.
Simulation-based diagnostics look at:
the entire distribution of data
The core idea:
- simulate data from the model
- compare simulated data to observed data
If they match → model is reasonable
If they don’t → model is missing something
Why This Lesson Matters
Residual plots are useful, but limited.
They may not detect:
- distributional mismatch
- variability misspecification
- nonlinear dynamics
Simulation-based diagnostics help answer:
“Can this model reproduce the data we actually observed?”
Visual Predictive Check (VPC)
A VPC works by:
- Simulating many datasets from the model
- Computing percentiles (e.g., 5th, 50th, 95th)
- Comparing them to observed data
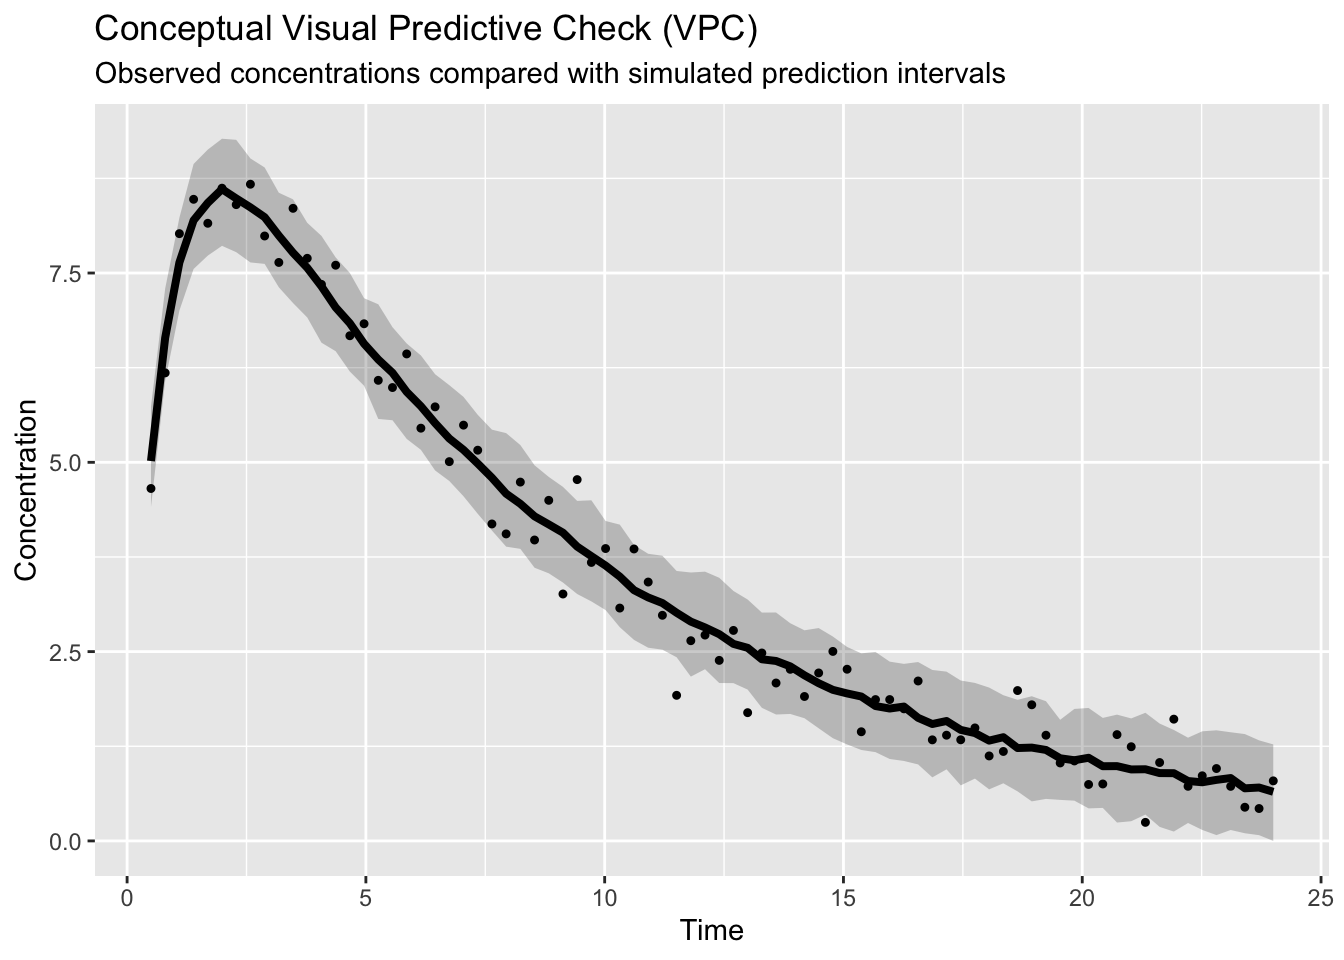
Worked Example: Visual Predictive Check (VPC)
A VPC compares:
- observed concentrations
- simulated prediction intervals
The goal is to evaluate whether the model reproduces:
- central tendency
- variability
- profile shape
Interpretation:
- shaded region → simulated prediction interval
- solid line → simulated median profile
- points → observed concentrations
A useful model should reproduce both:
- the typical concentration profile
- the spread of observations
Interpreting a VPC
A VPC asks:
“Does the observed dataset look like something the model could have generated?”
Good VPC:
- observed points remain mostly inside prediction intervals
- observed trend follows simulated median
Potential problems:
- observed median outside interval → structural misspecification
- intervals too narrow → underestimated variability
- intervals too wide → overestimated variability
Posterior Predictive Check (PPC)
PPC extends the same idea into a Bayesian setting.
Instead of using a single parameter estimate:
- simulate from the posterior distribution
- propagate parameter uncertainty
- compare simulated and observed datasets
Conceptually:
Posterior
↓
Simulate
↓
Compare
↓
Evaluate
This allows uncertainty in parameters to influence predictions.
Insight: PPC evaluates whether uncertainty and variability are both represented realistically.
Insight
Simulation diagnostics evaluate whether the model can recreate the behavior of the observed system.
Note
A model may fit observations well and still fail to reproduce variability.
Simulation-based diagnostics reveal that mismatch.
Strategies
- Use VPC alongside residual diagnostics
- Check both central tendency and variability
- Look for systematic deviations
Common Mistakes
- Overinterpreting small deviations
- Ignoring variability mismatch
- Relying only on residual plots
Practice Problems
- What is the purpose of a VPC?
- What does it mean if observed data fall outside prediction bands?
- How does PPC differ from VPC?
TipStep-by-Step Solutions
- To compare simulated and observed data distributions
- The model is missing structure or variability
- PPC uses posterior distributions and full uncertainty
Summary
Simulation-based diagnostics:
- evaluate full data distributions
- detect model misspecification
- complement residual diagnostics
Simulation diagnostics evaluate prediction—not just fit.
TipQuick Tips
- VPC = compare distributions
- Check median and spread
- Combine with residuals
- Focus on patterns, not noise