Exposure Metrics: AUC, Cmax, and Tmax
Understand the core exposure metrics in NCA, how they are calculated, and how they connect to clinical decisions.
Tip
What you’ll build today: a deep understanding of AUC, Cmax, and Tmax—and how these metrics translate concentration–time data into clinically meaningful quantities.
Learning Objectives
By the end of this lesson, you will be able to:
- Define AUC, Cmax, and Tmax
- Interpret each metric in a clinical context
- Understand how these metrics relate to exposure and response
- Recognize limitations of summary metrics
Key Ideas
NCA reduces a full concentration–time profile into a few key metrics:
- AUC → total exposure
- Cmax → peak concentration
- Tmax → time of peak
These metrics summarize different aspects of the same profile.
Area Under the Curve (AUC)
AUC represents total drug exposure over time.
\[ AUC = \int C(t) \, dt \]
Interpretation:
- Higher AUC → greater exposure
- Lower AUC → lower exposure
Insight: AUC is often considered the most broadly informative NCA metric because it summarizes total exposure.
Peak Concentration (Cmax)
Cmax is the maximum observed concentration.
Interpretation:
- Related to toxicity risk
- Important for drugs with narrow therapeutic windows
Time of Peak (Tmax)
Tmax is the time at which Cmax occurs.
Interpretation:
- Reflects rate of absorption
- Important for onset of action
Worked Example: Interpreting Metrics Together
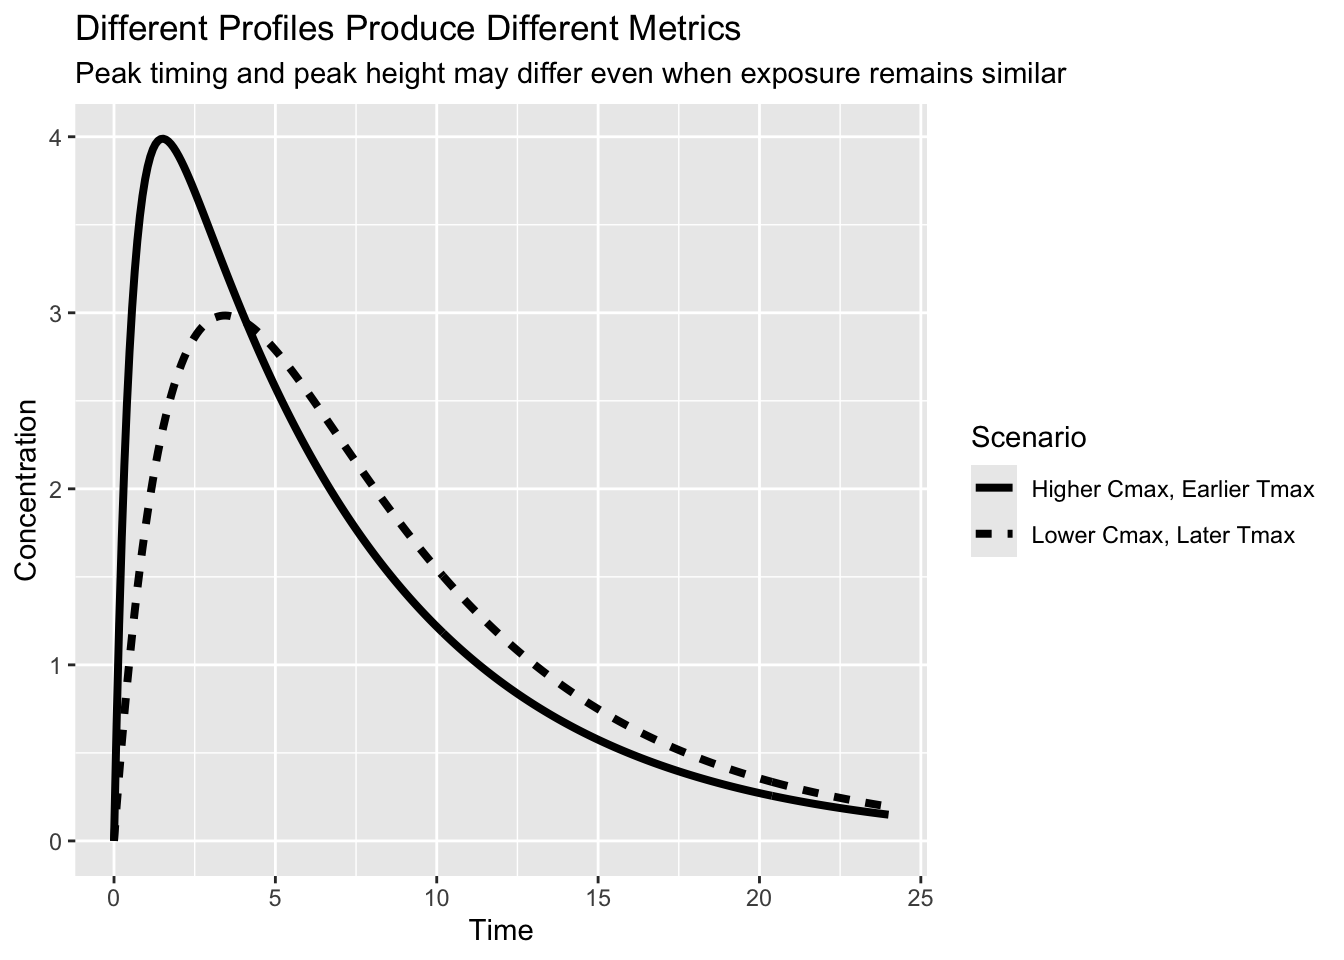
Different profiles can produce different exposure metrics.
The goal is to compare:
- overall exposure (AUC)
- peak concentration (Cmax)
- timing of peak (Tmax)
Compare the profiles:
- Which reaches peak first?
- Which has larger Cmax?
- Does one necessarily have much greater total exposure?
Notice:
- one profile peaks earlier
- one profile peaks higher
- total exposure remains more similar than peak height suggests
Expanding the Example
Now summarize the profiles.
| Profile | AUC | Cmax | Tmax |
|---|---|---|---|
| Higher Cmax, Earlier Tmax | Similar | Higher | Earlier |
| Lower Cmax, Later Tmax | Similar | Lower | Later |
This reveals something important:
AUC, Cmax, and Tmax measure different aspects of exposure.
That means:
- changing peak does not guarantee changing exposure
- changing timing does not guarantee changing exposure
- no single metric fully describes a profile
Exposure is multi-dimensional—not a single number.
Insight
AUC, Cmax, and Tmax capture different dimensions of exposure.
Note
No single metric fully describes a concentration–time profile.
Why These Metrics Matter
They support decisions such as:
- bioequivalence comparisons
- dose proportionality
- safety assessments
Metrics Can Move Independently
Changes in one metric do not guarantee changes in another.
Examples:
- AUC may increase while Cmax stays similar
- Cmax may increase with minimal AUC change
- Tmax may shift without changing exposure
This is why interpretation should always consider multiple metrics together.
Limitations of Summary Metrics
- Lose detailed shape information
- Cannot distinguish mechanisms
- Sensitive to sampling design
Common Problem Types
- Missing peak concentration
- Sparse sampling biasing AUC
- Misinterpreting Tmax variability
Strategies
- Use metrics together, not in isolation
- Ensure adequate sampling
- Interpret in clinical context
Common Mistakes
- Treating AUC as the only relevant metric
- Ignoring Cmax-related toxicity
- Overinterpreting Tmax
Practice Problems
- What does AUC represent?
- Why is Cmax clinically important?
- What does Tmax tell you?
TipStep-by-Step Solutions
- Total exposure over time
- It relates to peak toxicity risk
- It reflects absorption rate
Summary
- AUC → total exposure
- Cmax → peak exposure
- Tmax → timing of peak
Together, they provide a compact summary of drug exposure.
TipQuick Tips
- AUC = exposure
- Cmax = peak risk
- Tmax = timing
- Use all three together
- Always consider context