Variability in Observed PK Data
Understand where variability comes from, how it appears in concentration–time data, and why it matters in pharmacometric reasoning.
Tip
What you’ll build today: intuition for the different sources of variability in PK data and why variability is central rather than incidental in pharmacometrics.
Learning Objectives
By the end of this lesson, you will be able to:
- Identify common sources of variability in observed PK data.
- Distinguish between biological variability and measurement-related variability.
- Explain why variability is informative rather than merely inconvenient.
- Recognize why individual profiles should be examined before relying on averages.
Key Ideas
Variability appears because real studies involve:
- different subjects
- imperfect measurements
- changing study conditions
- biological systems that do not behave identically across people
That means variation is not just “messiness.” It is part of the phenomenon we are trying to understand.
Insight: Variability is often the reason pharmacometrics is needed in the first place.
Warning
If you treat all variability as random noise, you may hide the very differences that matter for dose selection, safety, and interpretation.
Sources of Variability
At a broad level, observed PK variability can come from:
- biological differences between subjects
- measurement error in observed concentrations
- study design differences such as timing inconsistencies
- within-subject variation across occasions or conditions
These are not interchangeable.
They may look similar on a plot, but they have different meanings.
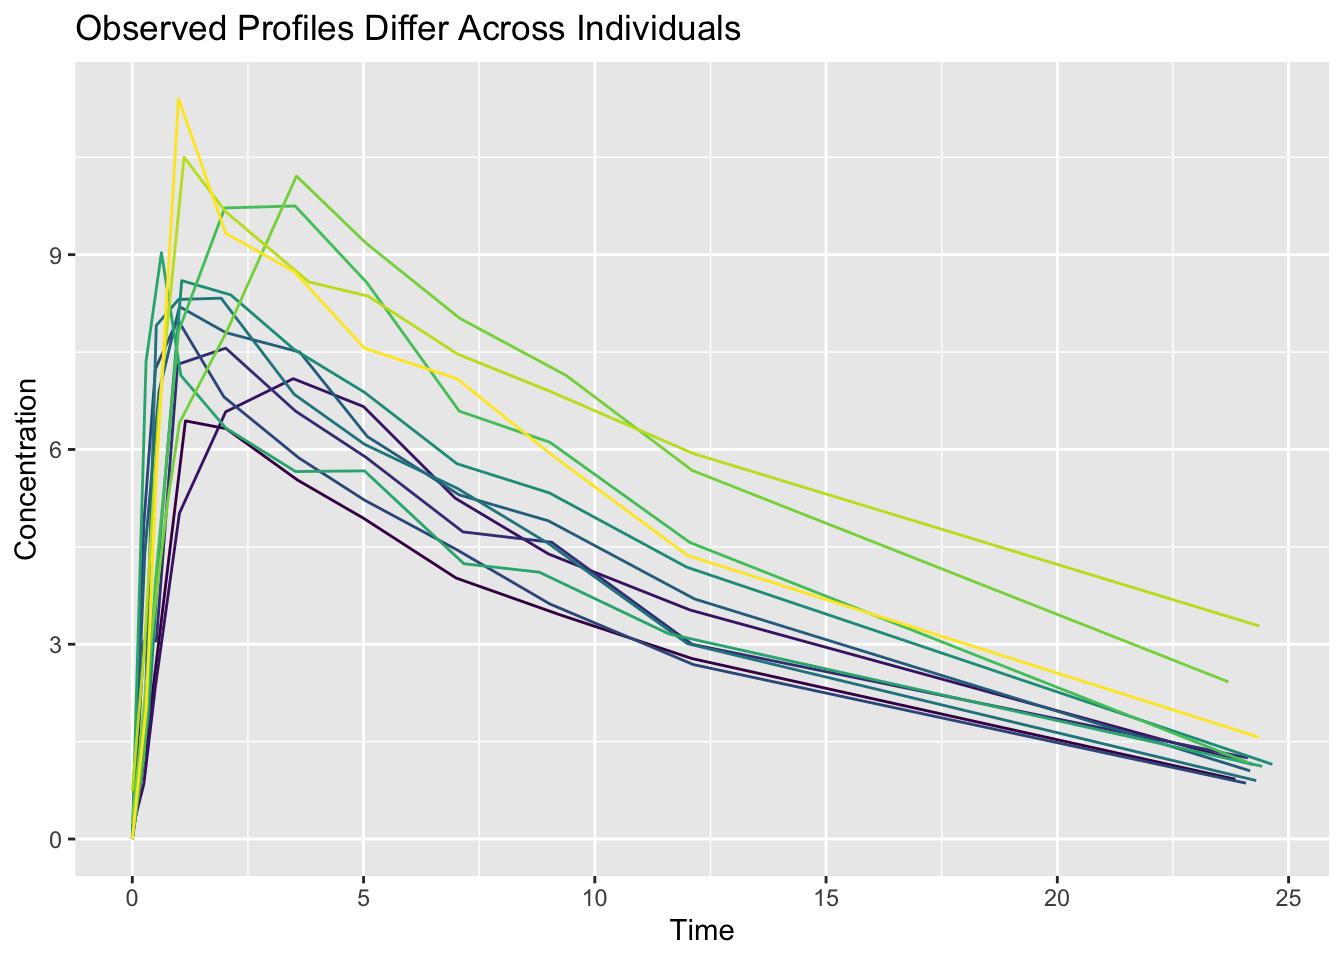
Worked Example: Individual Profiles in Theoph
Here, subjects do not all follow the same profile.
Some rise higher.
Some peak earlier or later.
Some decline differently.
That variation is not a nuisance to be ignored. It is central to understanding how drug handling differs across people.
Worked Example Expansion: Why Means Can Mislead
Imagine collapsing all subjects into a single summary profile.
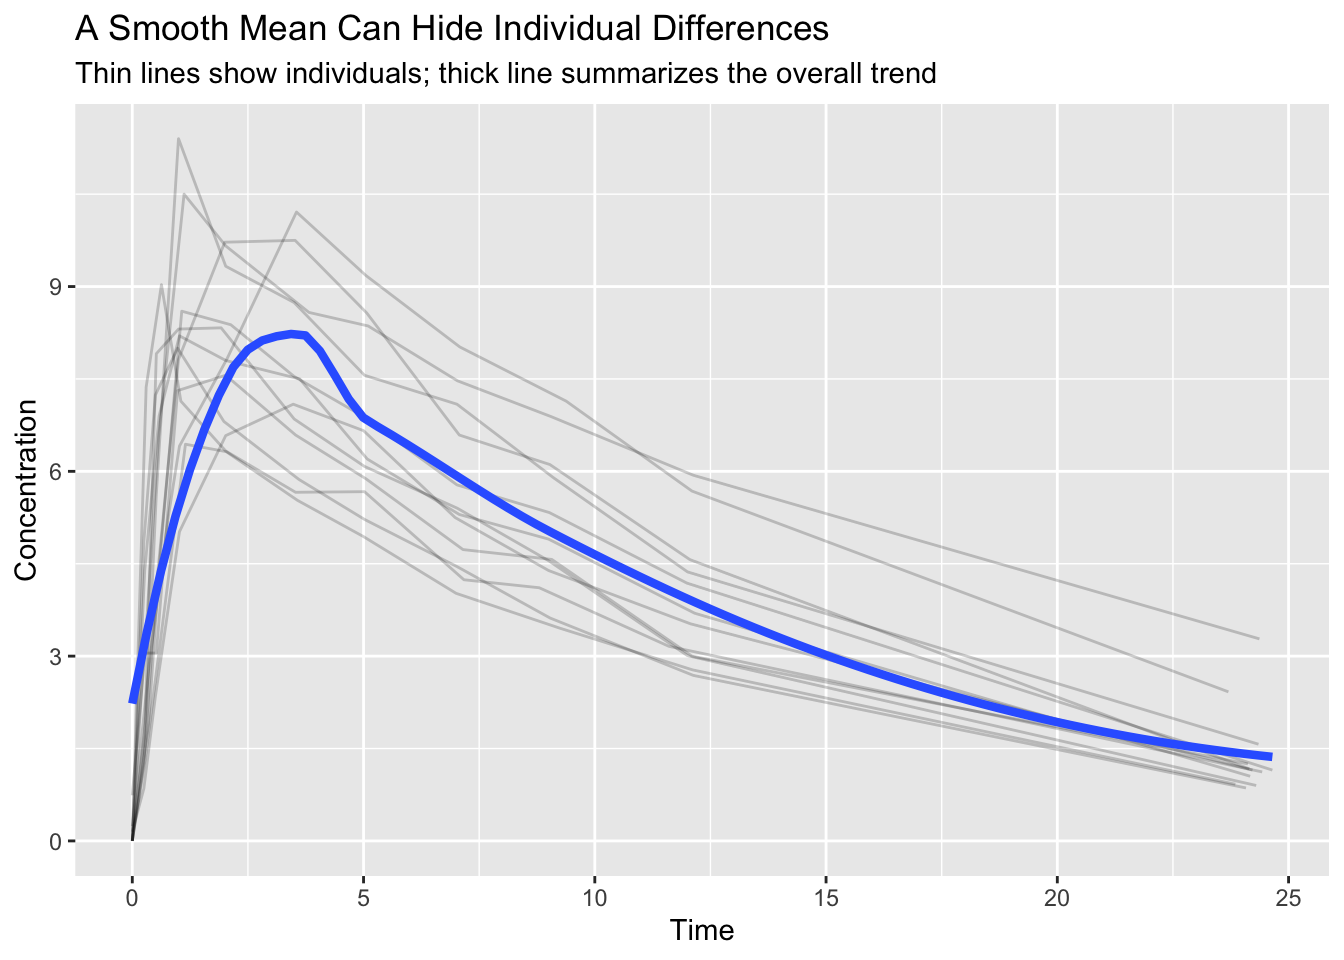
The smooth line gives a useful summary.
But notice what disappears:
- individual peak differences
- spread across subjects
- unusual profiles
- timing differences
The summary is easier to read, but less informative.
Insight
Variability explains why:
- one dose may not suit all subjects
- population-level decisions require more than a single profile
- models must represent both typical behavior and spread around that behavior
A world with no variability would require much less pharmacometrics.
Note
A useful question is: “What kind of variability am I seeing here, and what might it mean biologically or analytically?”
Common Problem Types
- High variability across subjects
- Differences in profile shape, peak timing, or magnitude between individuals
- Measurement noise and assay variability
- Data that appear noisy or inconsistent across time or subjects
- Limited ability to distinguish variability sources from observed data alone
Strategies
- Examine individual profiles before relying on averages
- Ask whether observed spread looks biological, analytical, or design-related
- Use variability as a clue, not just a complication
- Interpret heterogeneity as potentially meaningful until shown otherwise
Common Mistakes
- Ignoring variability and focusing only on average behavior
- Treating all spread as measurement error
- Over-smoothing profiles through aggressive summarization
- Failing to distinguish subject differences from design or assay issues
- Using only summary profiles without examining individuals
- Assuming all subjects behave similarly because the average looks clean
- Treating variability as an annoyance instead of a scientific signal
Practice Problems
- Name two possible sources of variability in observed PK data.
- Why can a mean profile hide important information?
- Why is variability important for dose selection?
- What question should you ask when you see spread across profiles?
TipStep-by-Step Solutions
- Examples include biological differences between subjects and measurement error.
- Because averaging can hide outliers, subgroup patterns, and differences in profile shape or timing.
- Because dose decisions must account for how much subjects differ in exposure and response.
- Ask: “What kind of variability am I seeing, and what might be causing it?”
Summary
Variability is not an optional side topic in pharmacometrics.
It is one of the main reasons the field exists.
Observed PK data vary because people differ, measurements are imperfect, and designs reveal only part of the system. Understanding that variability is essential for interpreting data, building models, and supporting decisions.
TipQuick Tips
- Variability contains information.
- Look at individual profiles before averages.
- Different sources of variability have different meanings.
- A smooth mean profile can hide important heterogeneity.
- Ask what the variability might be telling you.