What you’ll build today: intuition for when PK systems behave predictably and when they stop behaving like simple scaled versions of themselves.
Learning Objectives
By the end of this lesson, you will be able to:
- Explain linear behavior in conceptual terms.
- Explain nonlinear behavior in conceptual terms.
- Recognize why profiles can look different on linear and log scales.
- Understand why non-proportional scaling with dose matters.
- Distinguish a simple proportional system from one that suggests saturation or complexity.
Key Ideas
In a linear system, changing dose tends to change exposure in a roughly proportional way.
In a nonlinear system, that proportional relationship breaks down.
That breakdown can happen because:
- absorption is limited or saturable
- elimination pathways become saturated
- binding or distribution behavior changes with concentration
- the system no longer behaves like a simple scaled-up version of itself
Insight: Nonlinearity is not just “a weird-looking curve.” It means the system may not scale predictably with dose.
A smooth curve does not guarantee linear behavior.
Linearity is about scaling, not just visual appearance.
Why Scale Matters
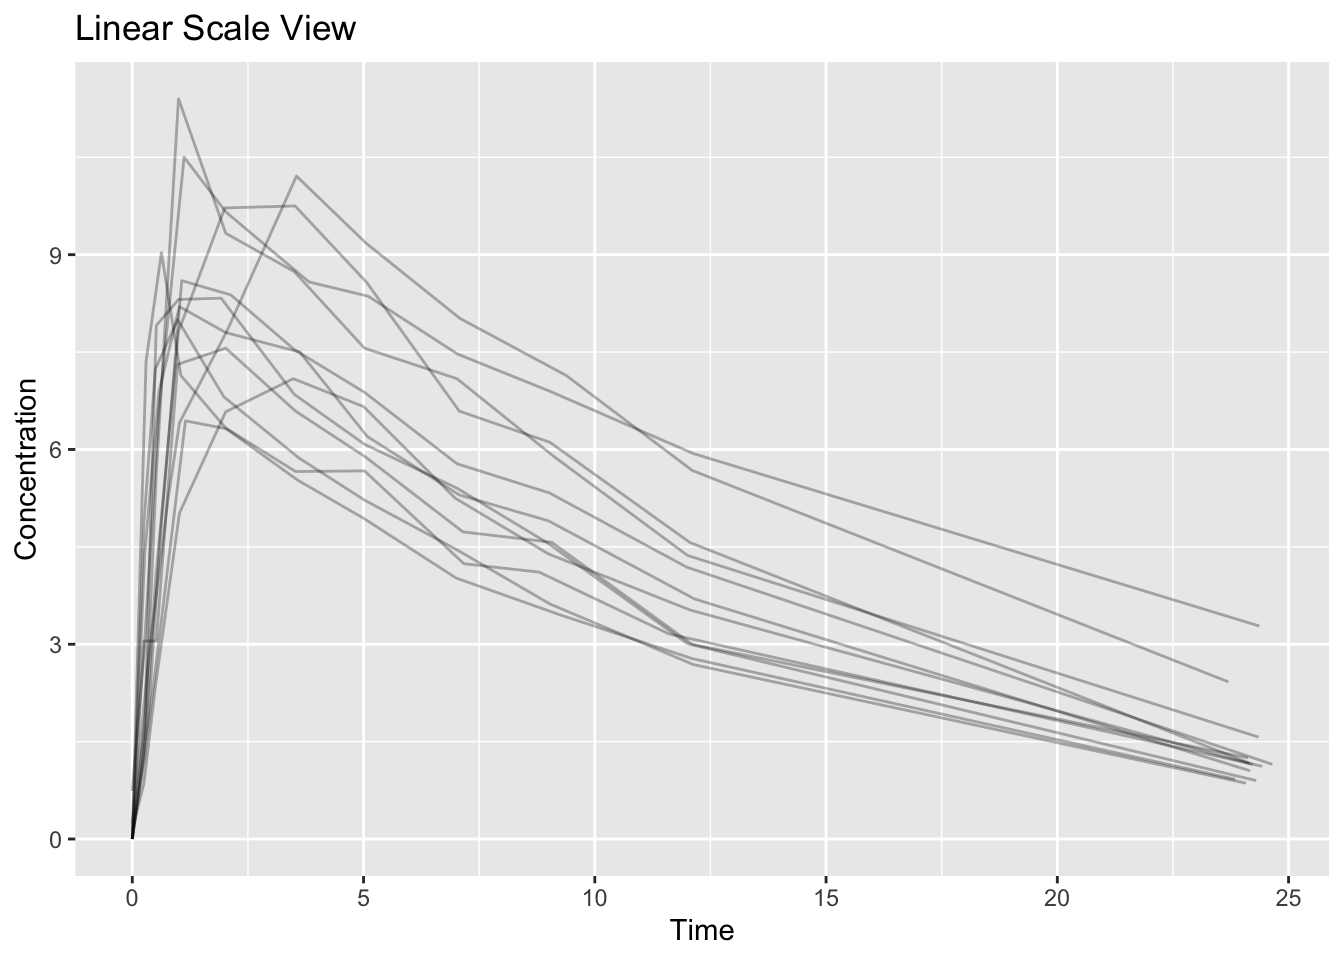
Linear and log scales emphasize different features of the same data.
- Linear scale highlights magnitude and peak behavior
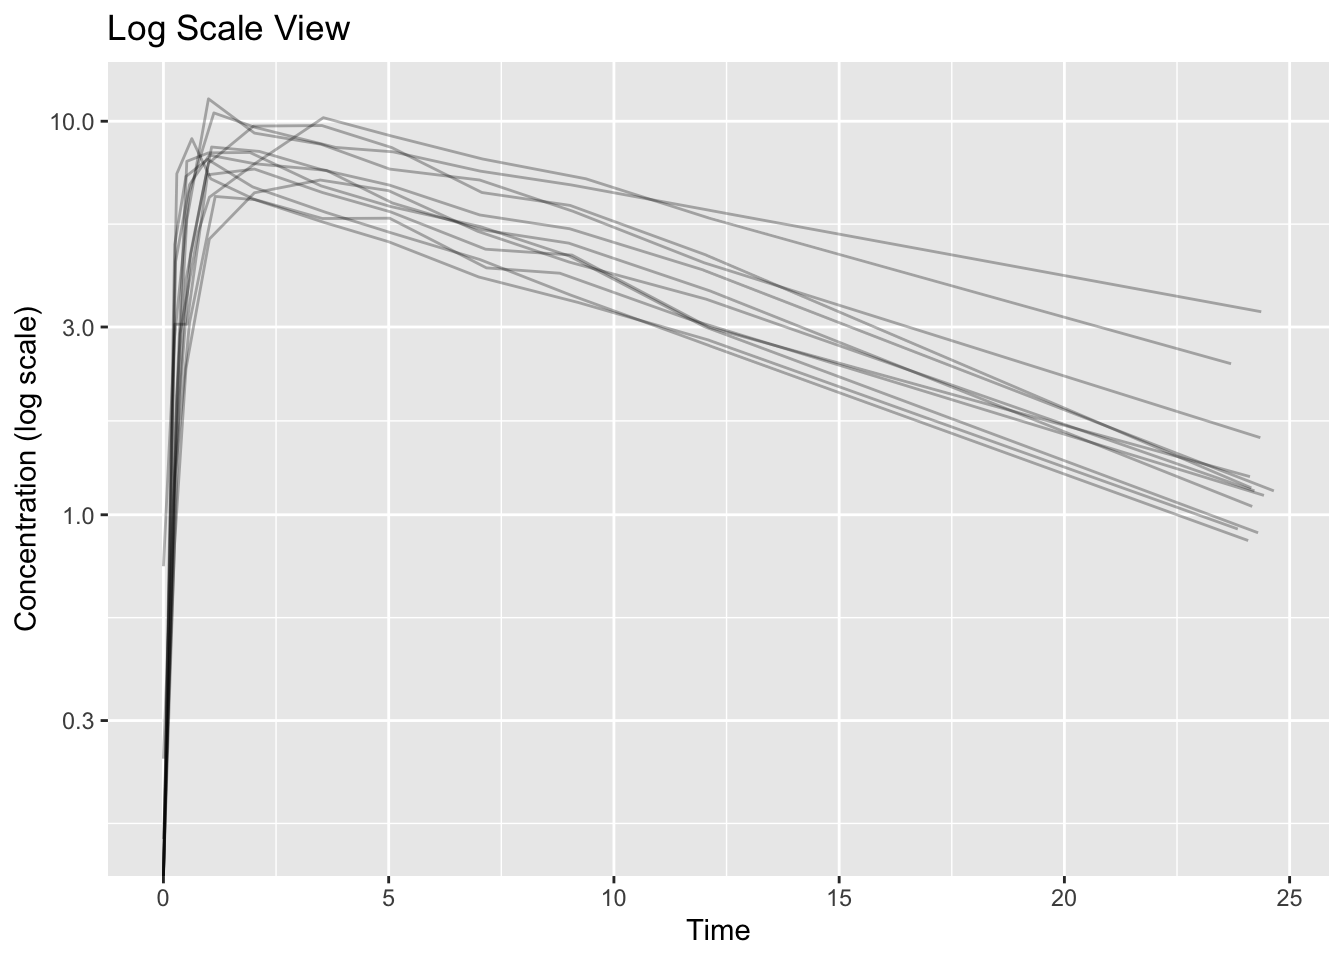
- Log scale highlights relative decline and late-time structure
A profile that looks simple on a linear scale may reveal multiple phases much more clearly on a log scale.
Worked Example: Linear vs Log Perspective
On the linear view, you mainly notice:
- peak height
- broad overall decline
On the log view, you may notice:
- slope changes
- late-time structure
- whether decline looks more like one phase or multiple phases
This is why PMx practitioners almost always inspect both.
Worked Example Expansion: Conceptual Dose Comparison
Imagine comparing a low dose and a doubled dose.
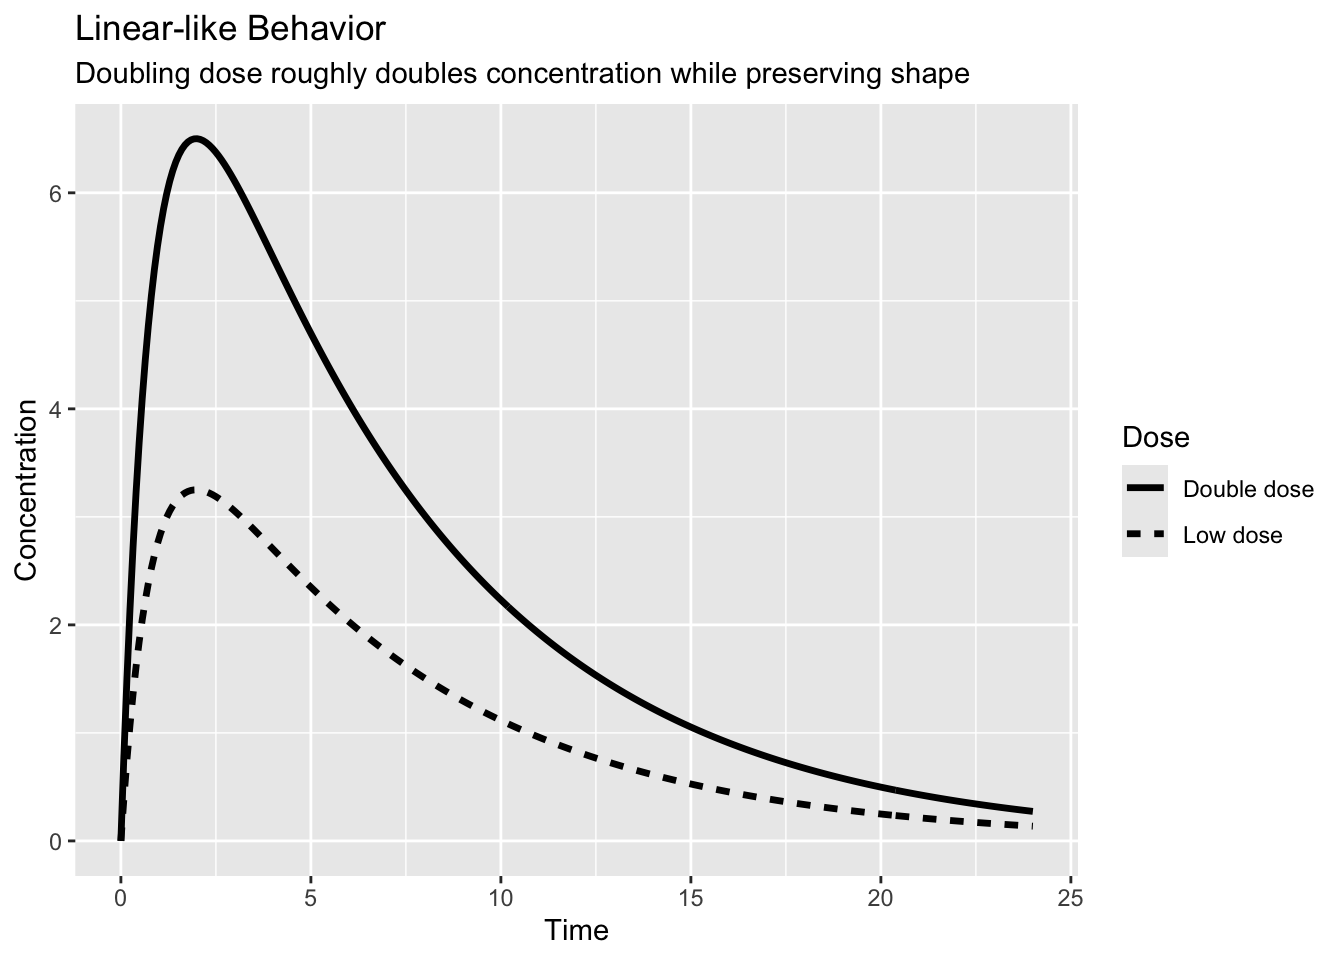
Linear-like behavior
In a linear system, doubling the dose roughly doubles the concentrations, but the overall shape stays similar.
The higher-dose profile is mostly a scaled-up version of the lower-dose profile.
That is the basic idea of linear PK behavior.
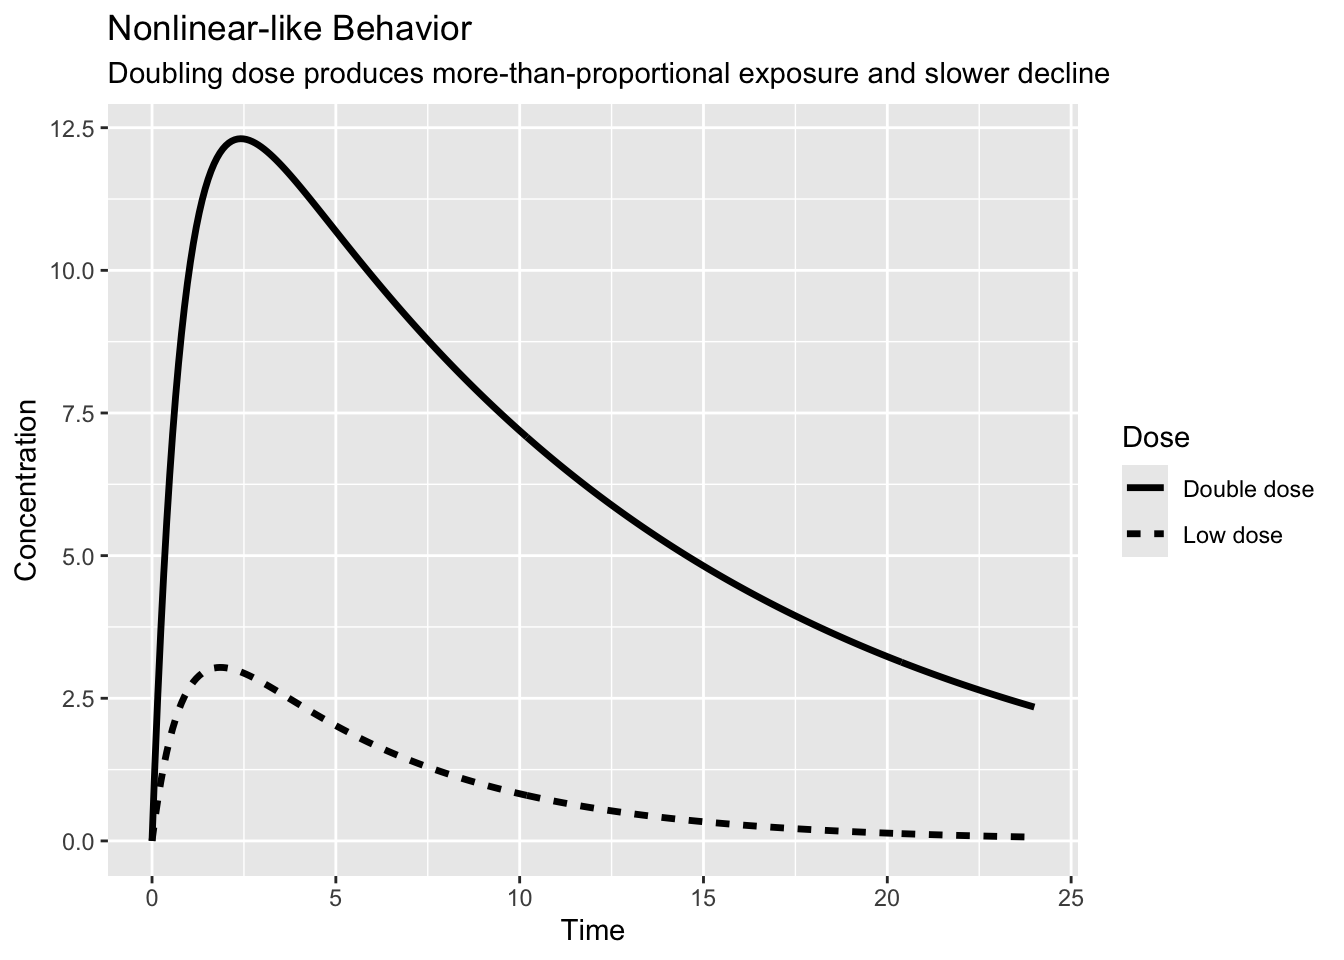
Nonlinear-like behavior
In a nonlinear system, doubling the dose may change exposure more than expected, and the profile may no longer look like a simple scaled version.
Here, the higher-dose profile is not just a doubled version of the lower-dose profile.
The concentrations rise more than expected, and the decline appears slower.
That is the key conceptual warning sign:
the system no longer behaves like a simple scaled version of itself.
Insight
Linear systems are easier to scale and predict.
But if exposure changes more than expected—or less than expected—then:
- simple scaling assumptions break
- predictions become riskier
- mechanistic interpretation becomes more important
- decision-making requires more caution
A practical question is: “If dose changes, should I expect this system to scale proportionally?”
Strategies
- Inspect both linear and log views
- Compare exposure across doses when possible
- Treat proportionality as a question, not an assumption
- Use unexpected scaling as a clue that the system may be more complex
Common Mistakes
- Assuming linearity without checking
- Ignoring scaling differences across doses
- Confusing smooth curves with linear systems
- Over-relying on single-dose interpretation
Practice Problems
- What does linear behavior usually imply about changing dose?
- Why is log scale often helpful in PK?
- What is one clue that behavior may be nonlinear?
- Why can nonlinearity matter for decision-making?
- That exposure tends to change roughly proportionally with dose.
- Because it can reveal relative decline, late-time structure, and slope changes more clearly.
- Exposure that changes more than proportionally or less than proportionally with dose.
- Because simple scaling assumptions become less reliable and predictions carry more risk.
Summary
Linear systems scale predictably. Nonlinear systems do not.
Recognizing that distinction requires thinking about:
- proportionality
- shape
- scale
- whether the system still behaves like a simple version of itself as dose changes
This is a major conceptual step in PK thinking.
- Linear usually means proportional scaling.
- Nonlinear behavior breaks that proportionality.
- Always inspect both linear and log views.
- Smooth curves are not automatically linear.
- Unexpected scaling is a clue, not something to ignore.