library(tidyverse)
library(nlme)

data(Remifentanil, package = "nlme")

remi <- as_tibble(Remifentanil) %>%
  rename(
    ID   = ID,
    TIME = Time,
    DV   = conc
  ) %>%
filter(!is.na(DV))Saving, Exporting, and Reusing Plots
Export PMx figures reliably (size, resolution, formats), and build reusable plotting functions and templates.
Tip
Core idea of this lesson: A good figure is not finished until it is exported correctly and can be reproduced consistently.
Learning Objectives
By the end of this lesson, you will be able to:
- Export plots with controlled size and resolution using
ggsave(). - Choose appropriate file formats for slides, reports, and manuscripts.
- Understand DPI, width, and height tradeoffs.
- Build reusable plotting functions for consistent PMx workflows.
- Separate figure construction from figure export.
Key Ideas
- A plot is not complete until it is exported correctly for its intended use.
- Export settings (size, resolution, format) determine how a figure appears outside R.
- The same plot object can be exported in multiple formats for different purposes.
- Vector formats (PDF, SVG) preserve quality; raster formats (PNG) depend on resolution.
- Plot construction and export should be treated as separate steps.
- Reusable plotting functions ensure consistency across analyses and reports.
Why Exporting Matters
A plot that looks good in the RStudio/Positron viewer can:
- look blurry in slides,
- appear cramped in a manuscript,
- or break layout when resized.
In PMx workflows, figures are often reused across:
- internal reports,
- regulatory documents,
- publications,
- slide decks.
Export settings must be intentional.
Setup
Worked Example 1: Build a Plot Object
Always assign plots to objects before exporting.
p <- ggplot(remi, aes(TIME, DV, group = ID)) +
  geom_line(alpha = 0.08, color = "grey35") +
  scale_y_log10() +
  labs(
    title = "Remifentanil Concentration–Time Profiles",
    x = "Time (min)",
    y = "Concentration (ng/mL, log10 scale)"
  ) +
  theme_minimal()

p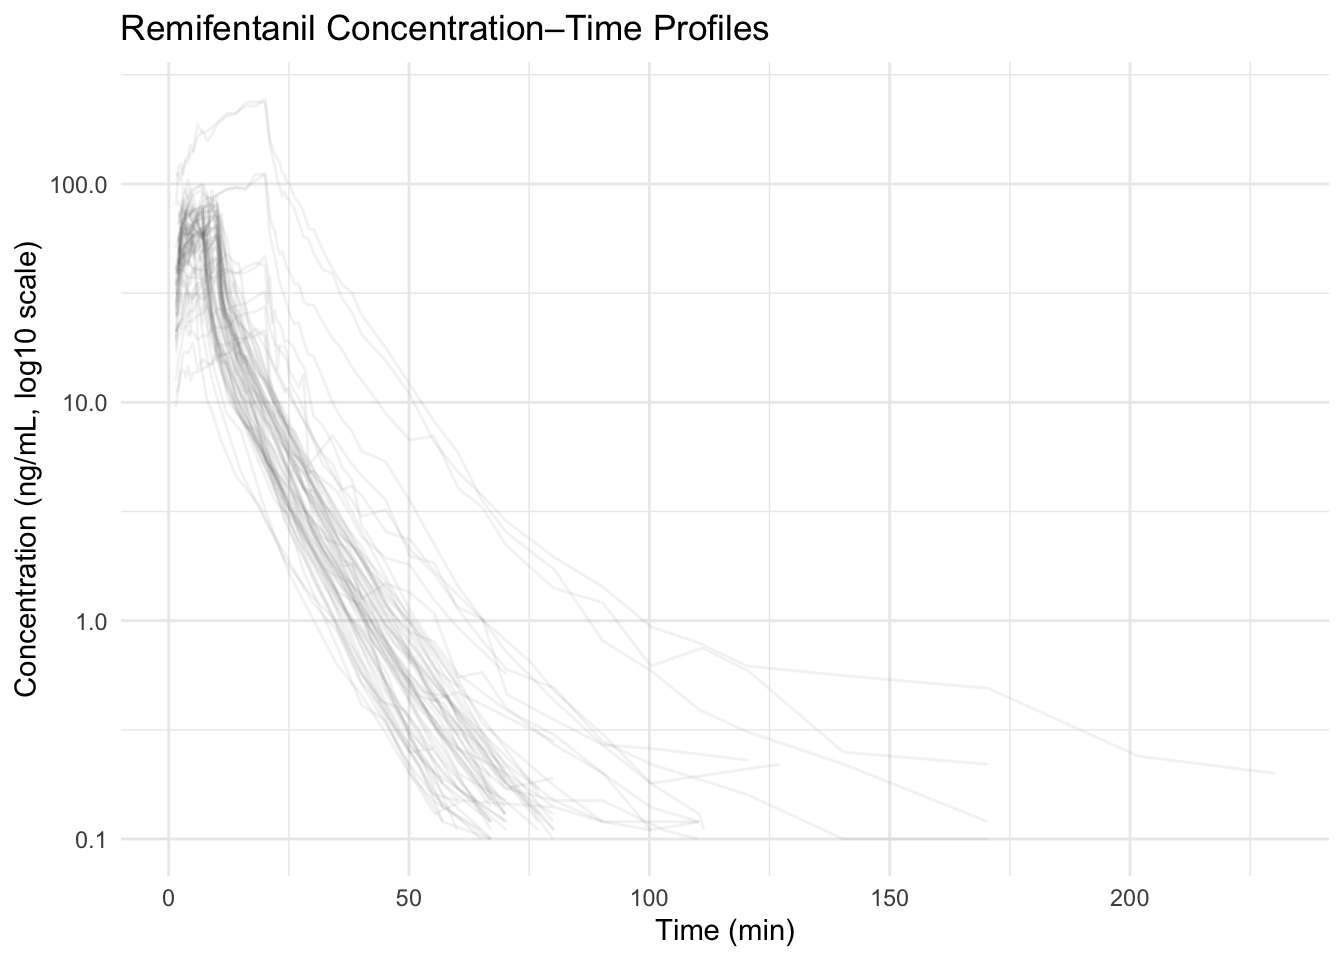
Worked Example 2: Export with ggsave()
Basic export:
ggsave(
  filename = "remi_profiles.png",
  plot     = p,
  width    = 6,
  height   = 4,
  dpi      = 300
)
What these arguments mean
width,height: physical size in inches
dpi: resolution (dots per inch)
filenameextension determines file type
Note
For manuscripts: 300–600 dpi is typical.
For slides: 150–300 dpi is usually sufficient.
File Format Guidance
PNG
- Good for slides and reports
- Raster (resolution-dependent)
- Vector format
- Ideal for manuscripts
- Scales without losing sharpness
ggsave(
  "remi_profiles.pdf",
  plot = p,
  width = 6,
  height = 4
)
SVG
- Vector format
- Useful for editing in Illustrator or similar tools
Common Export Problems
- Saving without specifying size.
- Resizing inside PowerPoint instead of exporting correctly.
- Using too low DPI for print.
- Forgetting to re-export after changing the plot.
Reusable Plot Functions
Instead of rewriting the same code repeatedly, build a function.
plot_profiles <- function(data, log_scale = TRUE) {
  g <- ggplot(data, aes(TIME, DV, group = ID)) +
    geom_line(alpha = 0.08, color = "grey35") +
    labs(
      x = "Time (min)",
      y = "Concentration (ng/mL)"
    ) +
    theme_minimal()

  if (log_scale) {
    g <- g + scale_y_log10() +
      labs(y = "Concentration (ng/mL, log10 scale)")
  }

  return(g)
}

p2 <- plot_profiles(remi)
p2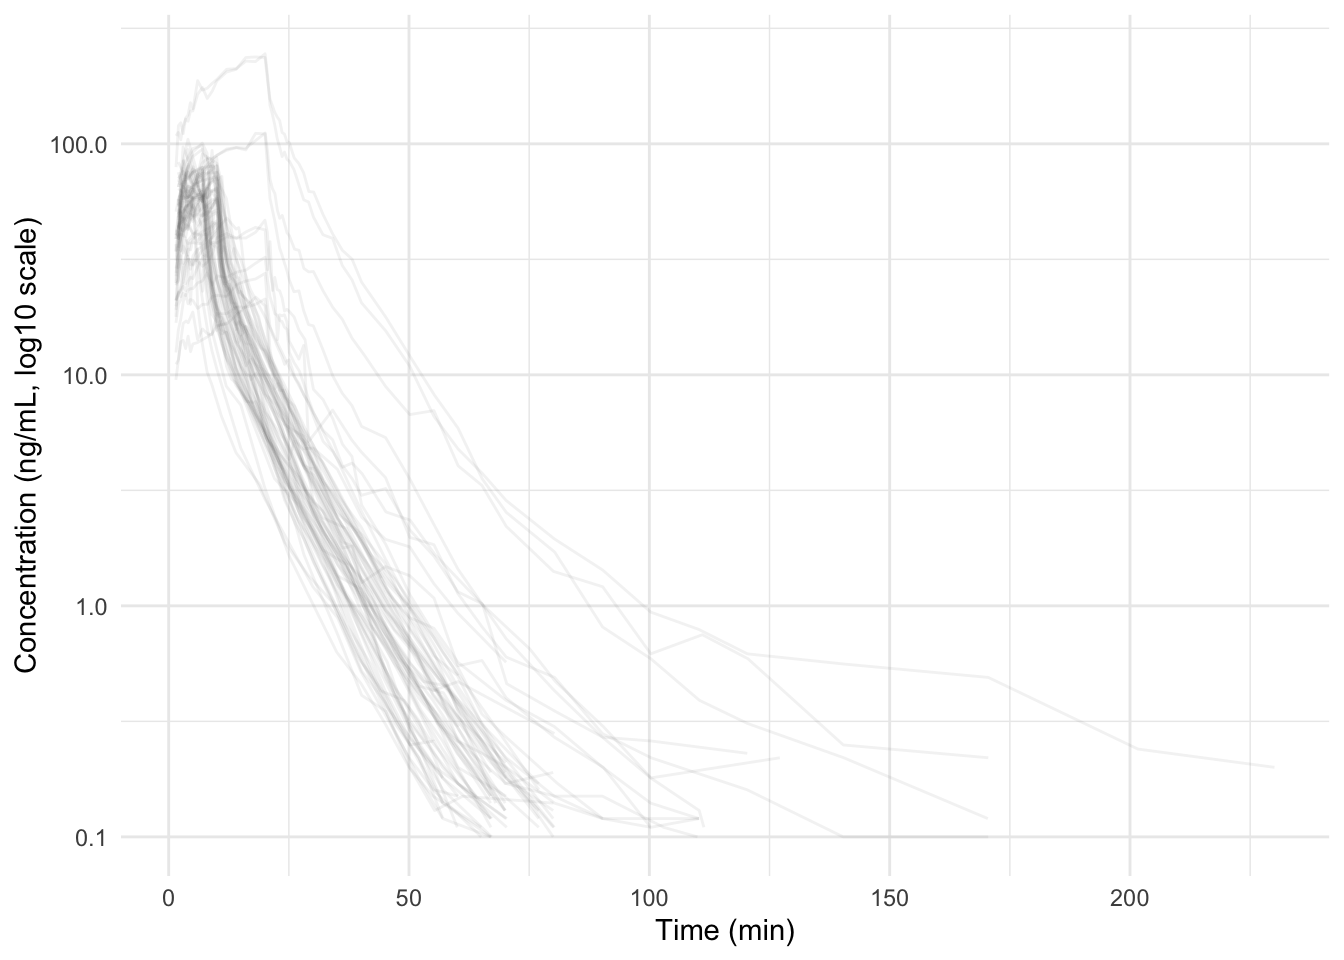
Now you have:
- consistent axis labels
- consistent styling
- reproducible figure logic
Separate Construction from Export
Good practice:
p <- plot_profiles(remi)

ggsave("figure1.pdf", p, width = 6, height = 4)
ggsave("figure1.png", p, width = 6, height = 4, dpi = 300)
One plot object → multiple formats.
Multi-Panel Export
If using patchwork or similar layout tools:
library(patchwork)

p_combined <- (p | p)

p_combined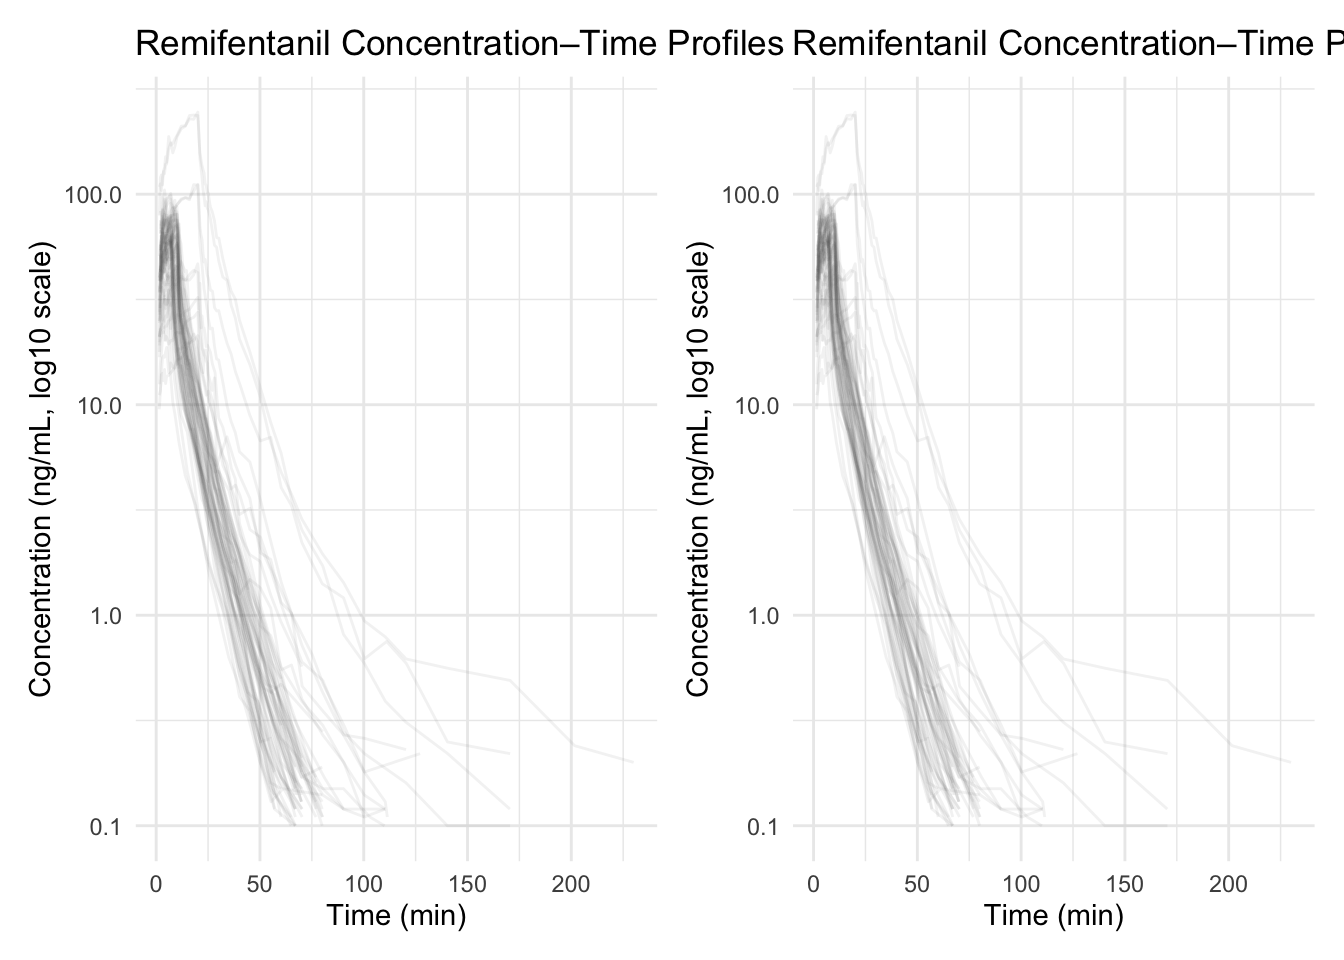
ggsave(
  "remi_combined.pdf",
  p_combined,
  width = 10,
  height = 4
)
Make sure the export size matches the intended layout.
Strategies
- Always save plot objects.
- Define export size intentionally.
- Use PDF for manuscripts, PNG for slides.
- Keep a consistent width/height across figures in a report.
- Store plotting functions in a utilities script for reuse.
Common Mistakes
- Relying on the RStudio/Positron viewer instead of exporting at the final size.
- Exporting plots before finalizing labels, scales, or themes.
- Using different sizes or formats for figures within the same report.
- Hardcoding plot settings repeatedly instead of using reusable functions.
- Treating export as a final step instead of part of the workflow.
- Not checking exported figures in their final destination (slides, PDF, etc.).
Practice Problems
- Export the same plot at 4×3 inches and 8×6 inches. Compare results.
- Export both PNG and PDF versions and inspect sharpness.
- Modify
plot_profiles()to add a subtitle argument. - Create a function that automatically exports both PNG and PDF.
- Decide on a “standard figure size” for your reports and justify it.
TipStep-by-Step Solutions
export_plot <- function(plot_obj, filename_base,
                        width = 6, height = 4) {
  ggsave(paste0(filename_base, ".pdf"),
         plot_obj, width = width, height = height)

  ggsave(paste0(filename_base, ".png"),
         plot_obj, width = width, height = height, dpi = 300)
}

export_plot(p2, "remi_profiles_standard")
Summary
In this lesson, you learned how to:
- Export figures with intentional size and resolution.
- Choose appropriate formats (PNG vs PDF).
- Avoid common export mistakes.
- Build reusable plotting functions.
- Separate figure construction from figure delivery.
A PMx figure is complete only when it is:
- correct,
- readable,
- and reproducibly exported.
TipQuick Tips
- Always assign your plot to an object (e.g.,
p <- ...) before exporting. - Control width and height explicitly — don’t rely on the RStudio/Positron viewer size.
- Use PDF/SVG when you need vector output (manuscripts, editing) and PNG for slides.
- For PNGs, start with 300 dpi (higher for print, lower for quick drafts).
- Export once in the final size you want to appear in your report/slide to avoid blurry resizing.
- One plot object → export to multiple formats (
.pdf+.png) for different deliverables.