Interpreting PK/PD Parameters
Big picture: PK/PD models are useful because their parameters often correspond to interpretable biological concepts.
Learning Objectives
By the end of this lesson, you will be able to:
- interpret common PK/PD parameters
- explain exposure–response relationships
- distinguish potency and efficacy
- interpret turnover parameters
- connect fitted values to biology
Key Ideas
PK parameters describe:
ExposurePD parameters describe:
ResponseJoint PK/PD models connect both.
Why Interpretation Matters
A fitted model produces numbers.
Interpretation converts numbers into biological understanding.
Question:
What does a parameter actually mean?Worked Example 1: Exposure versus Response
Recall:
Dose

↓

Concentration

↓

Response
PK describes:
- how much exposure occurs
- how quickly exposure changes
PD describes:
- how strongly response changes
- how quickly response develops
Worked Example 2: Interpreting Emax
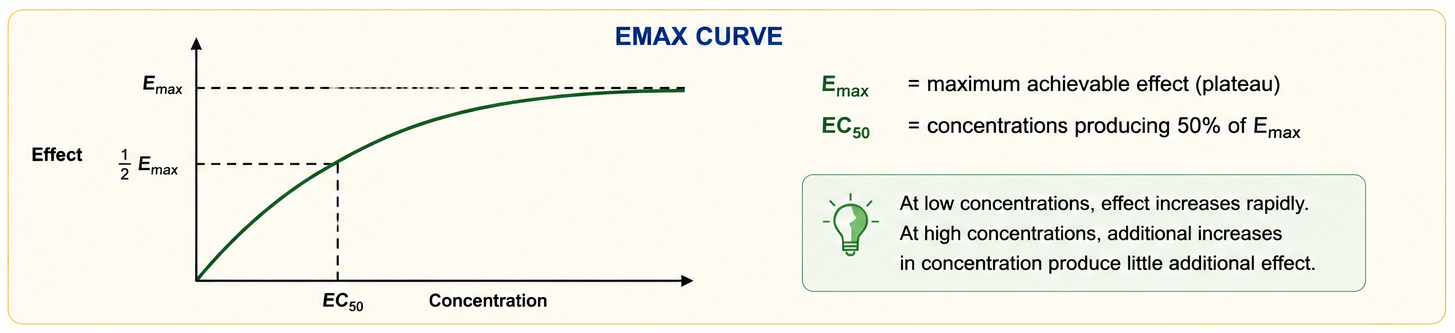
The Emax model:
\[ E = E_0 + \frac{ E_{max} C }{ EC_{50} + C } \]
Interpretation:
| Parameter | Meaning |
|---|---|
| \(E_0\) | baseline |
| \(E_{max}\) | maximum effect |
| \(EC_{50}\) | half-maximal concentration |
| \(C\) | concentration |
Question:
What happens if concentration keeps increasing?Interpretation:
Response approaches:
Emaxnot infinity.
Worked Example 3: Potency versus Efficacy
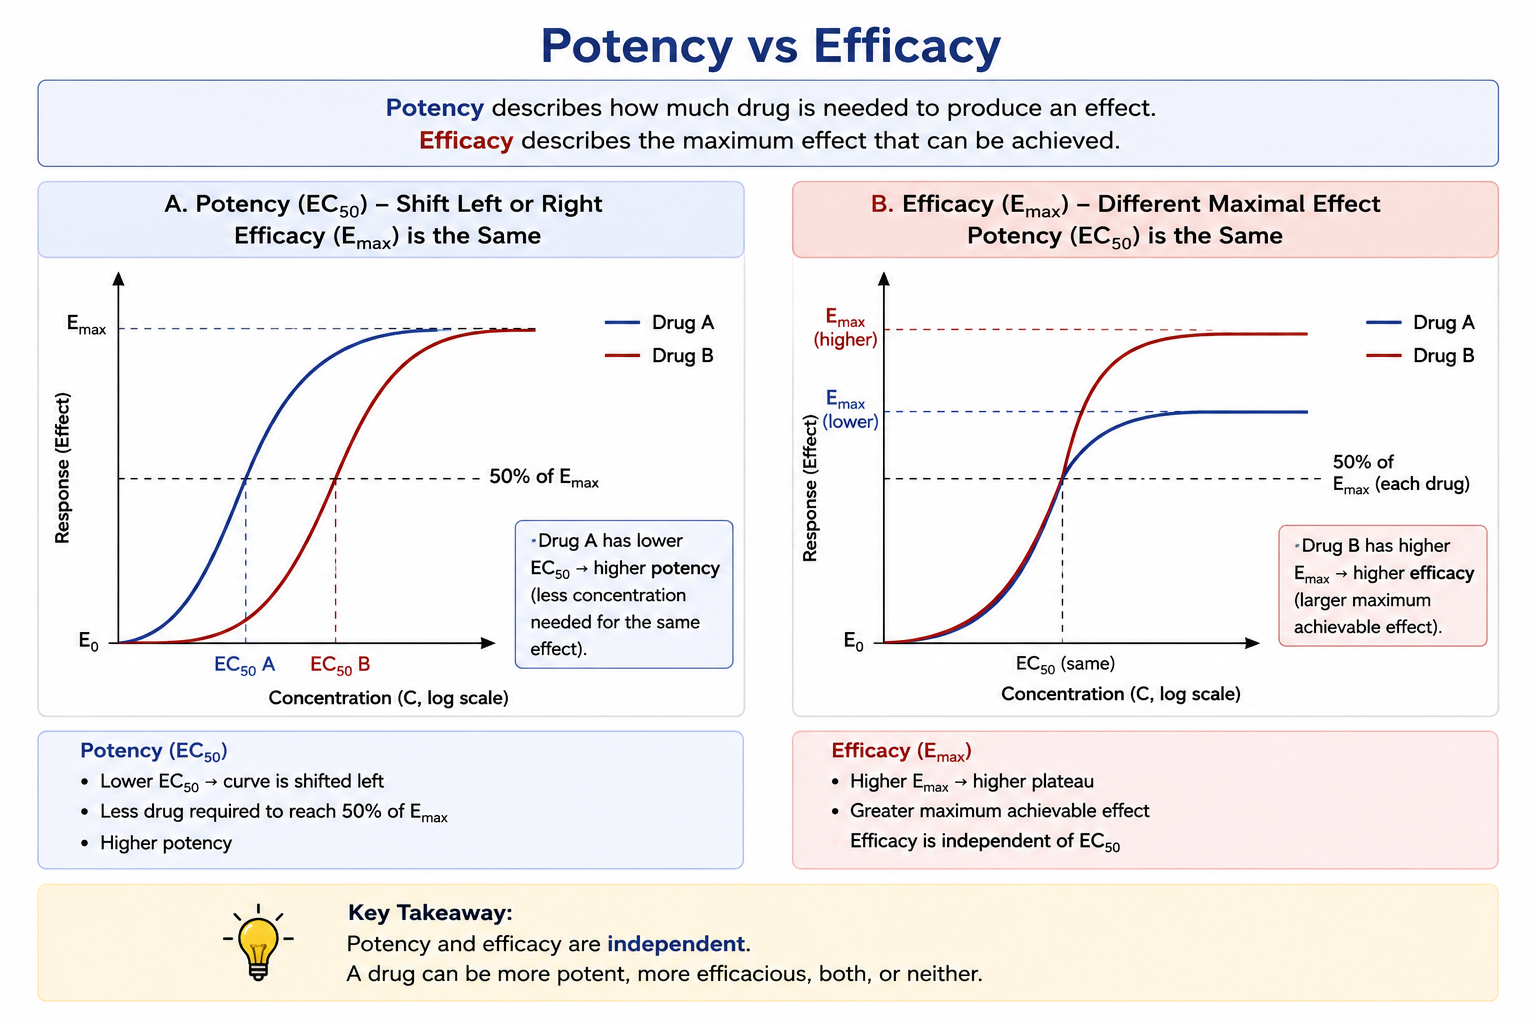
Students often confuse:
Potency ≠ EfficacyInterpretation:
| Parameter | Interpretation |
|---|---|
| lower \(EC_{50}\) | higher potency |
| larger \(E_{max}\) | larger achievable effect |
Examples:
Drug A:
high potency
low efficacy
Drug B:
lower potency
higher efficacyQuestion:
Would the better drug always have lower EC50?Not necessarily.
Worked Example 4: Interpreting Turnover Parameters
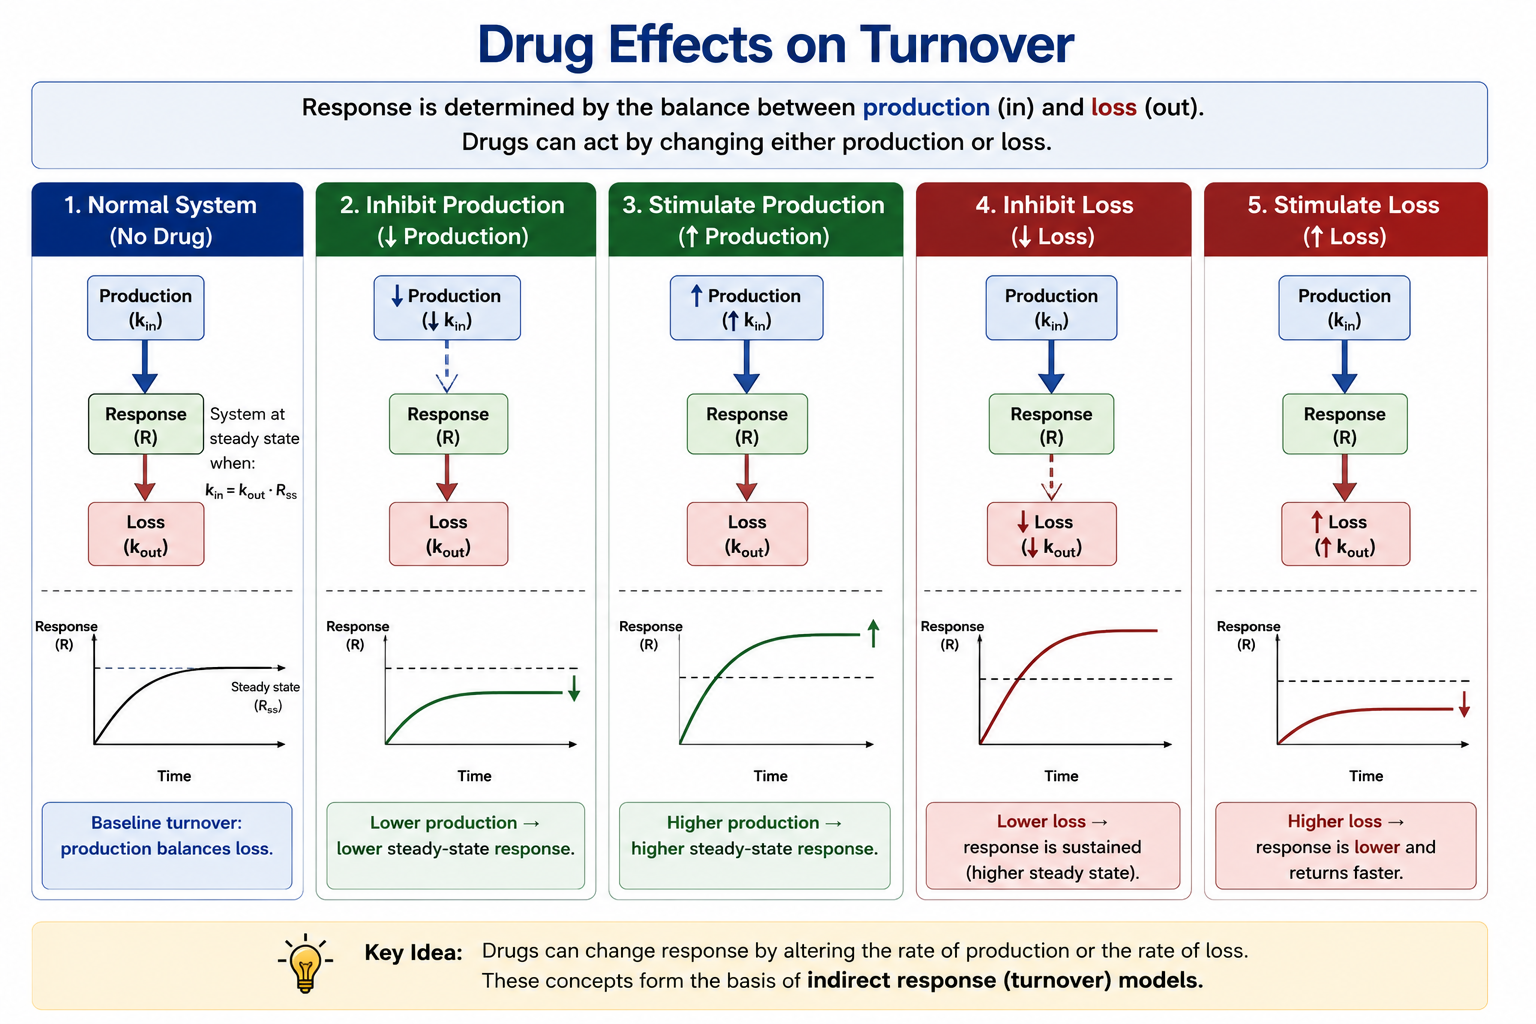
Recall the turnover model.
\[ \frac{dR}{dt} = k_{in} - k_{out}R \]
Interpretation:
| Parameter | Meaning |
|---|---|
| \(k_{in}\) | production |
| \(k_{out}\) | loss |
| \(R\) | response |
Question:
What happens when kout increases?Interpretation:
Faster return toward baselineQuestion:
What happens when kin increases?Interpretation:
Higher response generationWorked Example 5: Baseline and Equilibrium
At equilibrium:
\[ \frac{dR}{dt} = 0 \]
Therefore:
\[ R_0=\frac{k_{in}}{k_{out}} \]
Interpretation:
Baseline reflects balance.
Production

↓

Response

↓

Loss
Worked Example 6: Interpret the Warfarin Parameters
Recall the key pharmacodynamic parameters from the warfarin model.
Interpretation:
| Parameter | Meaning |
|---|---|
emax |
maximum inhibitory effect |
ec50 |
concentration producing half-maximal effect |
kout |
response turnover rate |
e0 |
baseline response |
Question:
Which parameter controls delay?Primarily:
koutInterpretation:
A larger kout means:
Faster system turnover
↓
Faster adjustment
↓
Shorter apparent delay
A smaller kout means:
Slower turnover
↓
Slower adjustment
↓
Longer apparent delay
Question:
Which parameter controls maximum response?Primarily:
emaxInterpretation:
Increasing emax allows larger changes in response.
Question:
Which parameter controls sensitivity?Primarily:
ec50Interpretation:
Lower ec50 means:
Less concentration needed
↓
Greater apparent potency
Question:
What determines baseline?Primarily:
e0Interpretation:
This represents the expected response before drug effect occurs.
The exact values vary by model and dataset.
The important goal here is understanding what each parameter means biologically.
Worked Example 7: Parameter Variability
Population models estimate:
Typical Parameter + Random EffectsInterpretation:
Large variability suggests:
- heterogeneous response
- different sensitivities
- larger uncertainty
Question:
Does strong variability imply poor model quality?No.
Variability may reflect biology.
Worked Example 8: Translating Parameters into Biology
Examples:
| Observation | Possible Interpretation |
|---|---|
| low EC50 | strong sensitivity |
| high Emax | large possible effect |
| low kout | delayed recovery |
| high kout | rapid recovery |
Interpretation:
Models become useful when parameters support decisions.
Strategies
- connect estimates to biology
- interpret parameters together
- distinguish exposure and response
Common Mistakes
- interpreting one parameter alone
- ignoring variability
- forgetting turnover dynamics
Practice Problems
What does Emax represent?
What does EC50 represent?
Which parameter mainly controls delay?
What does higher kout imply?
Why does variability matter?
Problem 1
Maximum achievable effect.
Problem 2
Concentration producing half-maximal effect.
Problem 3
Mostly:
koutProblem 4
Faster return toward equilibrium.
Problem 5
Individuals respond differently.
Summary
- PK describes exposure
- PD describes response
- Emax controls magnitude
- EC50 controls potency
- kin and kout control turnover
- interpretation connects models to biology
- Potency ≠ efficacy
- Delay ≠ variability
- Turnover explains timing