library(tidyverse)
library(rxode2)Interpreting Simulation Results
Learn how to interpret simulation outputs and connect predictions to model-informed decisions.
Tip
Big picture: Simulations generate predictions. Interpretation turns predictions into useful conclusions.
Learning Objectives
By the end of this lesson, you will be able to:
- interpret simulation outputs
- distinguish prediction from decision
- summarize exposure changes
- compare competing scenarios
- recognize limitations of simulation
Key Ideas
- simulation produces model-based predictions
- interpretation focuses on comparison
- decisions require context
- uncertainty should be acknowledged
Setup
This lesson focuses on interpretation.
No estimation is performed.
Why Interpretation Matters
A simulation produces numbers.
Interpretation produces meaning.
Conceptually:
Simulation Output

↓

Comparison

↓

Interpretation

↓

Decision
Two people can look at the same simulation and reach different conclusions.
Interpretation requires scientific context, clinical goals, and an understanding of model assumptions.
Questions become:
- what changed?
- how large was the change?
- does it matter?
Worked Example 1: Compare Two Simulated Scenarios
Reuse a simple PK model.
pk_model <-
  rxode2({

    ka <- 1
    cl <- 3
    v <- 30

    d/dt(depot) = -ka * depot
    d/dt(center) = ka * depot - cl / v * center

    cp = center / v

  })

ev_100 <-
  et(
    amt = 100,
    ii = 24,
    addl = 4
  ) %>%
  et(
    seq(0, 120, by = 0.5)
  )

ev_200 <-
  et(
    amt = 200,
    ii = 24,
    addl = 4
  ) %>%
  et(
    seq(0, 120, by = 0.5)
  )

sim_100 <-
  rxSolve(
    pk_model,
    ev_100
  ) %>%
  as_tibble() %>%
  mutate(
    SCENARIO = "100 mg"
  )

sim_200 <-
  rxSolve(
    pk_model,
    ev_200
  ) %>%
  as_tibble() %>%
  mutate(
    SCENARIO = "200 mg"
  )

sim_compare <-
  bind_rows(
    sim_100,
    sim_200
  )
Plot.
ggplot(
    sim_compare,
    aes(
        time,
        cp,
        linetype = SCENARIO
    )
) +
geom_line() +
labs(
    title = "Scenario Comparison",
    x = "Time",
    y = "Concentration"
)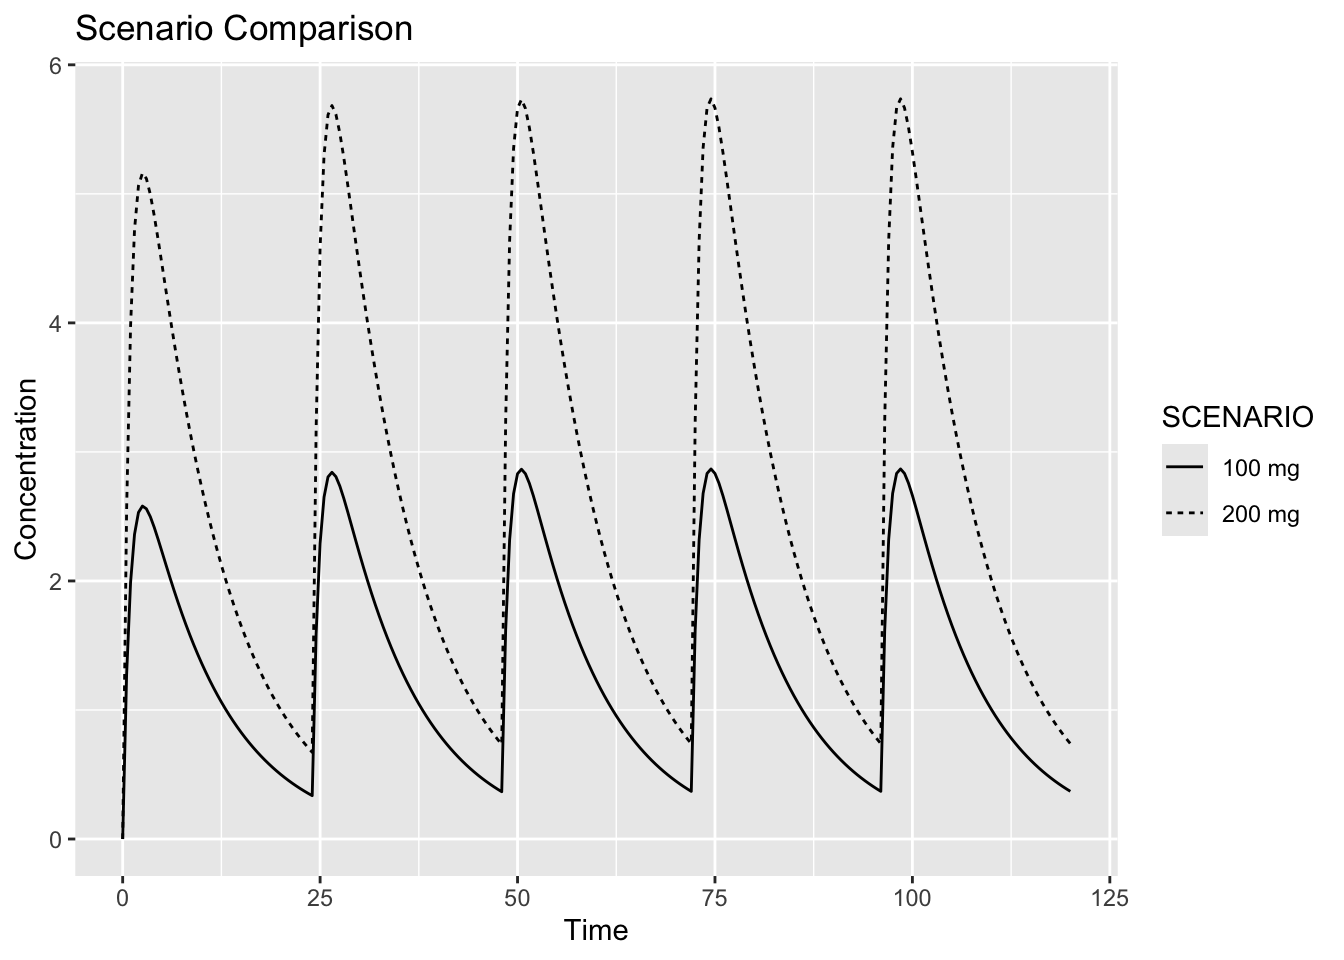
Interpretation:
The question is not:
Which scenario is better?Instead ask:
What changed?Worked Example 2: Summarize Simulation Outputs
Summaries help interpretation.
sim_compare %>%
  group_by(SCENARIO) %>%
  summarise(
    CMAX = max(cp),
    CMIN = min(cp),
    MEAN = mean(cp),
    .groups = "drop"
  )
# A tibble: 2 × 4
SCENARIO CMAX CMIN MEAN
<chr> <dbl> <dbl> <dbl>
1 100 mg 2.87 0 1.35
2 200 mg 5.74 0 2.70Interpretation:
Summaries convert curves into comparisons.
Large simulations may contain thousands of predicted concentrations.
Summary metrics help focus attention on quantities that are relevant for decision making.
Examples include:
- Cmax
- trough
- average exposure
- time above threshold
Question:
Did exposure increase meaningfully?Worked Example 3: Relative Change Matters
Absolute values can mislead.
In many applications, the size of a change is more informative than the raw value itself.
For example, a twofold increase in exposure is often easier to interpret than comparing concentrations measured in unfamiliar units.
Compute relative change.
sim_compare %>%
  group_by(SCENARIO) %>%
  summarise(
    CMAX = max(cp),
    .groups = "drop"
  ) %>%
  mutate(
    RELATIVE =
      CMAX /
      first(CMAX)
  )
# A tibble: 2 × 3
SCENARIO CMAX RELATIVE
<chr> <dbl> <dbl>
1 100 mg 2.87 1
2 200 mg 5.74 2.00Interpretation:
Questions become:
2×

1.5×

10%
rather than:
15

20

30
Interpretation often benefits from scale.
Worked Example 4: Simulations Are Not Truth
Simulation outputs depend on assumptions.
Conceptually:
Model

↓

Assumptions

↓

Predictions
Questions:
- was the model reasonable?
- was the scenario realistic?
- was variability represented?
Interpretation requires judgment.
Simulation does not guarantee future observations.
Predictions are generally more reliable when simulations remain close to the conditions used to build the model.
Large extrapolations beyond the observed data should be interpreted cautiously.
Worked Example 5: Connecting Simulation to Decisions
Simulation supports decisions.
It does not replace them.
Conceptually:
Observed Data

↓

Model

↓

Simulation

↓

Interpretation

↓

Decision
Examples:
| Question | Simulation Helps |
|---|---|
| increase dose? | compare exposure |
| reduce frequency? | compare accumulation |
| anticipate response? | predict trajectories |
| understand risk? | compare outcomes |
Interpretation should always communicate:
- assumptions
- uncertainty
- limitations
What Good Interpretation Looks Like
Weak interpretation:
Dose 2 looked higher.Better interpretation:
Dose 2 increased predicted exposure while preserving profile shape.Strong interpretation:
Dose 2 increased predicted exposure approximately twofold under the assumptions of the model.Interpret conclusions.
Do not simply describe plots.
A useful simulation answers a question. A useful interpretation explains what the answer means.
Looking Back at the Module
This module progressed from:
Why Simulate?
↓
Population Simulation
↓
Scenario Comparison
↓
Simulation From Fits
↓
Interpretation
Simulation becomes useful only when conclusions are meaningful.
Strategies
- compare scenarios
- summarize outputs
- communicate assumptions
Common Mistakes
- simulation = truth
- focusing on one metric
- ignoring uncertainty
Practice Problems
Why summarize simulations?
Why compare relative change?
Why does interpretation matter?
Does simulation prove outcomes?
What should interpretation communicate?
TipStep-by-Step Solutions
Problem 1
Summaries simplify comparisons.
Problem 2
Relative change improves interpretation.
Problem 3
Interpretation creates meaning.
Problem 4
No.
Simulation depends on assumptions.
Problem 5
Assumptions, uncertainty, and limitations.
Summary
- simulation produces predictions
- interpretation creates conclusions
- comparisons are often more useful than raw outputs
- decisions require context
TipQuick Tips
- Compare
- Summarize
- Interpret
- Communicate