library(tidyverse)
library(nlmixr2)
library(nlmixr2data)

data(
  "theo_sd",
  package = "nlmixr2data"
)
Why Variability Matters
Understand why population models require variability and how variability differs from structural behavior.
Tip
Big picture: Population modeling exists because subjects do not behave identically.
Learning Objectives
By the end of this lesson, you will be able to:
- explain why variability is necessary in population modeling
- distinguish structural behavior from variability
- distinguish fixed effects and random effects conceptually
- recognize sources of variability
- explain why population models estimate more than one profile
Key Ideas
- Structural models describe average behavior.
- Population models describe populations.
- Subjects differ biologically.
- Variability is expected, not failure.
Setup
Why Structural Models Are Not Enough
Suppose we estimate:
CL = 3
V = 30
ka = 1.5
Does every subject behave exactly like this?
No.
Real populations show differences.
Examples:
Subject A
↓
Fast Absorption

Subject B
↓
Slow Elimination

Subject C
↓
Larger Volume
Population models attempt to represent these differences.
Worked Example 1: Visualize Subject Differences
Plot concentration profiles.
ggplot(
  theo_sd,
  aes(
    TIME,
    DV,
    group = ID
  )
) +
geom_line(
  alpha = 0.3
) +
labs(
  title = "Observed Profiles by Subject",
  x = "Time",
  y = "Concentration"
)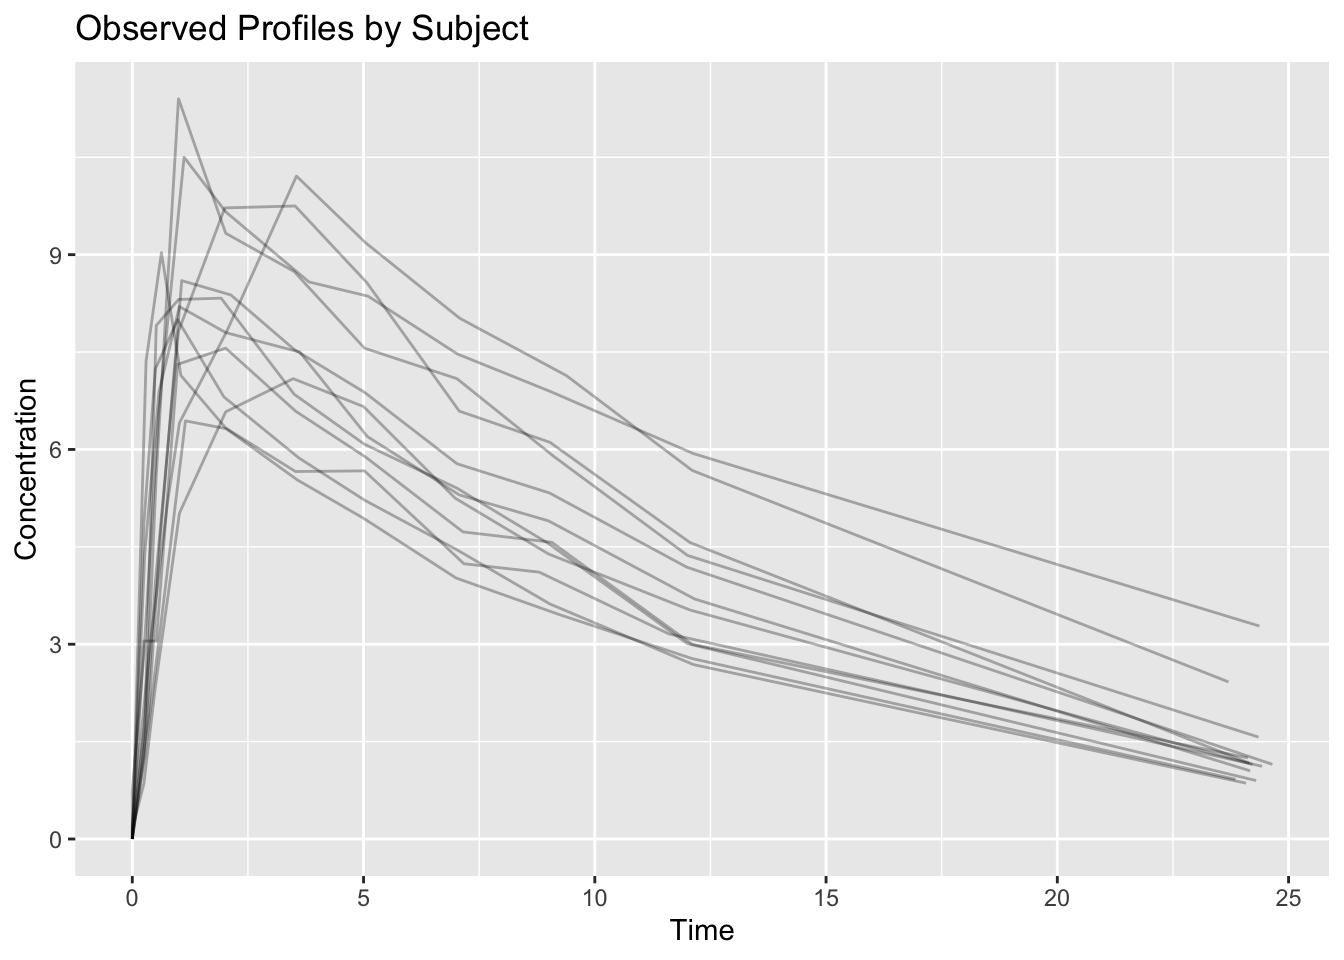
Interpretation:
Subjects follow similar overall behavior.
But profiles are not identical.
This motivates population modeling.
Worked Example 2: Typical Subject vs Individual Subjects
Conceptually:
Typical Subject
↓
Population Estimate
versus
Individual Subject
↓
Population Estimate
+
Variability
Population models estimate both.
Worked Example 3: Connect to Earlier Models
Earlier we fit:
ka <- exp(tka + eta.ka)

cl <- exp(tcl + eta.cl)

v <- exp(tv + eta.v)
You already saw these terms.
Conceptually:
Typical Parameter
+
Random Effect
↓
Individual Parameter
Examples:
Typical CL = 3

Subject 1 → 2.6

Subject 2 → 3.4

Subject 3 → 2.9
The random effect determines how individuals differ.
Worked Example 4: Sources of Variability
Variability may arise from:
Biology
↓
Weight
Age
Disease
Genetics
or:
Observation Process
↓
Measurement Error
Assay Noise
Sampling Differences
Population models attempt to separate these sources.
Worked Example 5: Fixed Effects and Random Effects
Population models contain multiple parameter types.
| Type | Meaning |
|---|---|
| Fixed effects | typical population values |
| Random effects | individual differences |
| Residual error | remaining disagreement |
Conceptually:
Observed Data
↓
Population Mean
+
Variability
+
Residual Error
This structure transforms structural PK into population PK.
Why Variability Is Useful
Variability allows us to:
- represent populations
- estimate uncertainty
- explain subject differences
- support covariate analysis
- improve prediction
Without variability:
One Subject = Entire Populationwhich is unrealistic.
Transition to ETA Models
We now understand:
Typical Parameters
↓
Individual Differences
Next we ask:
How does the model represent variability mathematically?The next lesson introduces ETA models.
Strategies
- Start with biological thinking.
- Separate average behavior from variability.
- Expect populations to differ.
Common Mistakes
- Interpreting one profile.
- Confusing variability and residual error.
- Treating random effects as model failure.
Practice Problems
Why are structural models insufficient?
What does variability represent?
Explain:
Typical Parameter
+
Random Effect
↓

Individual Parameter
Name three possible biological sources of variability.
Explain the difference between:
Fixed Effects

Random Effects

Residual Error
TipStep-by-Step Solutions
Problem 1
Structural models describe average behavior.
Population models additionally represent differences.
Problem 2
Variability describes how individuals differ.
Problem 3
Population estimates describe the typical subject.
Random effects allow individual subjects to differ.
Problem 4
Examples:
- weight
- age
- disease
Problem 5
Fixed effects: typical values
Random effects: subject differences
Residual error: remaining disagreement
Summary
- Population models represent populations.
- Subjects differ biologically.
- Random effects describe differences.
- Residual error remains after prediction.
- Variability motivates later covariate modeling.
TipQuick Tips
- Population ≠ individual
- Variability ≠ failure
- Random effects ≠ residual error